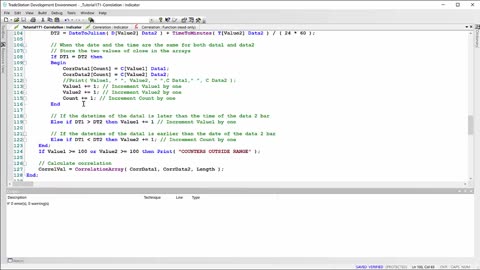
3 years agoTradeStation tutorial 171 | Correlation indicator for when bars ‘missing’ in a data streamMarkplex
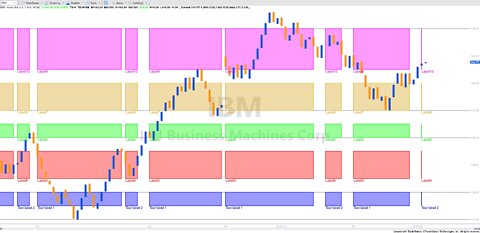
2 years agoTutorial 114 (DT4) | Drawing boxes on a chart between time periods each day with text labelsMarkplex
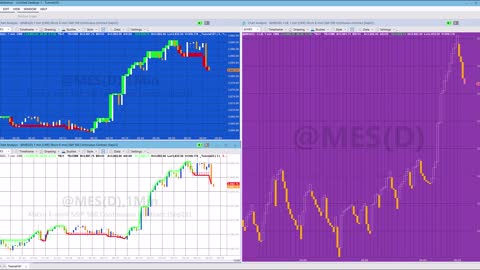
2 years agoTutorial 181 | Three Line Break on minute chart using a vector object | TradeStation tutorialsMarkplex
2 years agoQuickTip 74 | Finding the highest pivot on a chart | TradeStation EasyLanguage tutorialsMarkplex
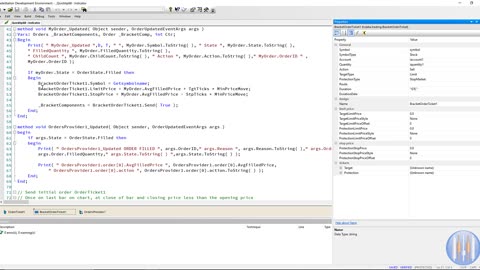
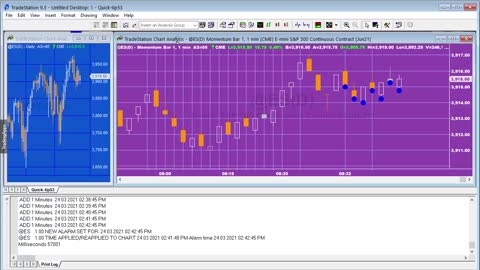
3 years agoQuick-tip 53 | How to modify tutorial 116 to reload the chart data at regular intervalsMarkplex
2 months agoMichael Buble: "I Will NEVER Be Carefree Again!", Rejection, Cancer & Stealing!The Diary Of A CEO
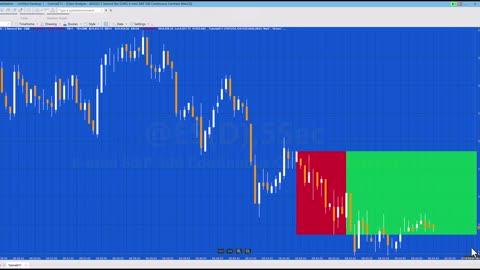
1 month agoTutorial 211 | Create a rectangle between 2 times and the highest/lowest price between those timesMarkplex