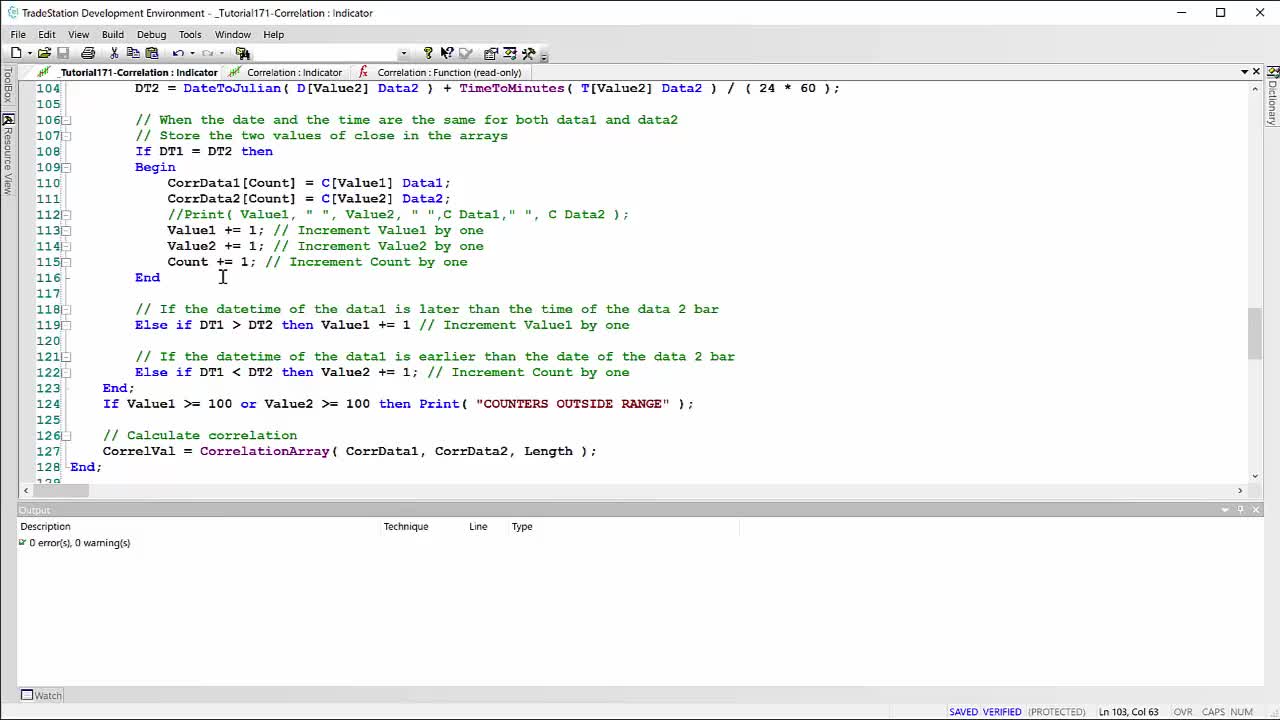
TradeStation tutorial 171 | Correlation indicator for when bars ‘missing’ in a data stream
3 years ago
3
Tutorial 171 for TradeStation EasyLanguage, demonstrates how to create a correlation indicator for data pairs where one of the data pairs has ‘missing bars.’ For example, for symbol 1 (data1) trading might have occurred on every bar during the trading session. Symbol 2 might be more thinly traded and hence it doesn’t have trading activity on every bar.
See https://markplex.com/free-tutorials/tutorial-171-correlation-indicator-when-bars-missing/
Join Gold Pass: https://markplex.com/markplex-membership/
Loading comments...
-
 0:45
0:45
Performing in an Academic Environment
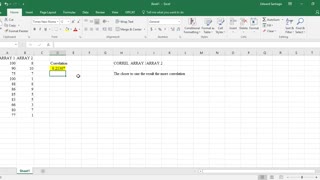
3 years agoMicrosoft Excel Tutorial - Correlation
101 -
 8:26
8:26
EcTech
3 years agoA Stream Deck for FREE? | StreamPi Tutorial
43 -
 9:43
9:43
Markplex
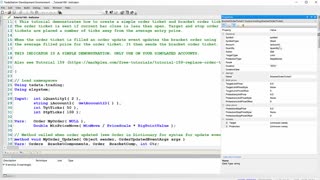
3 years agoTutorial 169 | Order ticket and bracket ticket for TradeStation EasyLanguage
16 -
 5:52:08
LearnZone
3 years agoLearn Data Science Tutorial - Full Course
44 -
 1:20
1:20
Gymnastics for you
3 years agoCartwheel tutorial 1
322 -
 14:19
14:19
Penny Duncan Creations
3 years agoCarnations Tutorial
24 -
 6:29
6:29
arreed
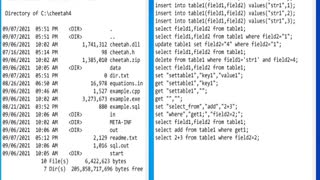
3 years agocheetah tutorial
1131 -
 5:52:08
Skillz2learn
3 years agoLearn Data Science Tutorial | For Beginners
38 -
 1:51
1:51
Caio
3 years agoPool skimmer tutorial
39 -
 2:08:42
The Dilley Show
13 hours ago $35.84 earnedH1B Visa Debate, Culture and More! w/Author Brenden Dilley 12/26/2024
122K40