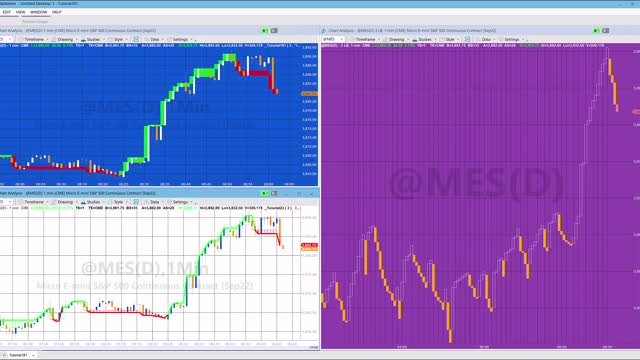
Tutorial 181 | Three Line Break on minute chart using a vector object | TradeStation tutorials
Tutorial 181 from Markplex.com talks through the creation of an indicator to ‘mimic’ the behavior of a three line break chart. The functionality is very similar to tutorial 23 however, whereas tutorial 23 uses an array, this tutorial uses the Vector class.
See the tutorial pages:
Tutorial 23 - https://markplex.com/free-tutorials/tutorial-23-creating-3-line-break-3lb-indicator-apply-normal-candlestick-charts/
Tutorial 181 - https://markplex.com/free-tutorials/tutorial-181-three-line-break-on-normal-chart-using-vectors/
Line break charts
Line breaks charts ignore time. New ‘up’ lines are only added when a bar closes higher than the high of the previous up line. Once up lines are being drawn price has to go below the low of a specified number of up lines in order to create a new down line. New ‘down’ lines are only added when a bar closes below than the low of the previous down line. Once down lines are being drawn price has to go above the high of a specified number of down lines in order to create a new ‘up’ line.
This tutorial program is designed to be applied to a minute (e.g. 5 minute, 15 minute, 60 minute) bar chart. Because these charts do have a linear time element multiple ‘lines’ would be drawn whereas on an actual line break chart the same move would be represented by one line.
Technical lessons covered in this tutorial include:
Converting an EasyLanguage program to use a Vector rather than an array
Drawing rectangles using the legacy EasyLanguage syntax (e.g. TL_New) and also using the Rectangle object and formatting options
Converting legacy date and time to a DateTime object
Converting color objects for use in the plot statement
Using methods to create and update drawing objects
Ensuring that there are only a maximum number of drawing objects drawn on the chart.
-
 6:49
6:49
Russell Brand
23 hours ago"HE'S A RUSSIAN PLANT!" CNN Loses It ON AIR!
119K162 -
 13:10
13:10
The Rubin Report
1 day agoWhy the Real Challenge Is Just Beginning | Jordan Peterson
62.9K23 -
 1:02:55
Tactical Advisor
5 hours agoBuilding a Truck Gun -Battle Hawk Build of the Month | Vault Room Live Stream 017
42K -
 42:41
42:41
Athlete & Artist Show
4 hours ago $1.41 earnedSeason 5 Episode 3 LIVE
26.1K2 -

I_Came_With_Fire_Podcast
12 hours agoThe US GOVERNMENT is PLANNING a UAP FALSE FLAG ATTACK
22.3K6 -
 18:10
18:10
Sideserf Cake Studio
6 hours ago $0.92 earnedIs This the ULTIMATE Cake Smashing Moment?
24.9K2 -
 12:51
12:51
Misha Petrov
19 hours agoTrump KICKS OUT Zelenskyy After HEATED White House Meeting!
23.9K60 -
 16:39
16:39
Tactical Considerations
1 day ago $0.90 earnedWatchtower Apache Double Stack 1911 Made Me Question Everything?
19.2K -
 16:20
16:20
T-SPLY
7 hours agoCNN Meltdown Over Zelesnky Disrespecting Donald Trump And JD Vance
16.2K20 -
 8:39
8:39
Silver Dragons
1 day agoGold & Silver Price KEEP DROPPING 👀
11.6K7