Premium Only Content

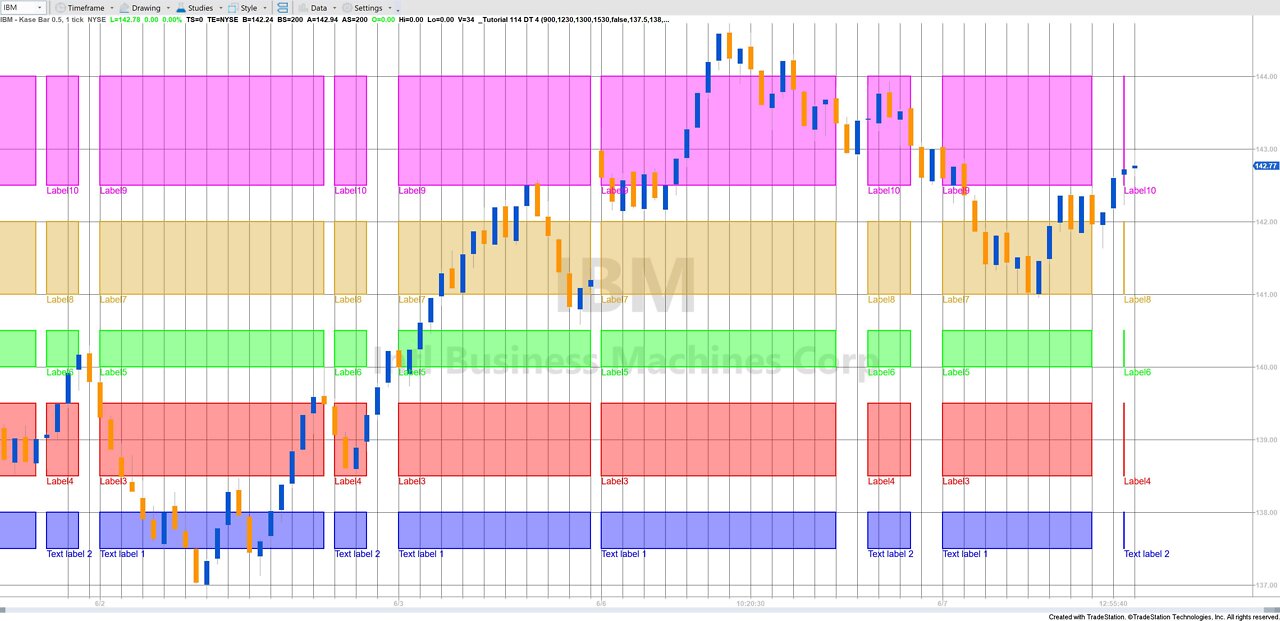
Tutorial 114 (DT4) | Drawing boxes on a chart between time periods each day with text labels
The original Tutorial 114 draws boxes across the entire chart, Tutorial 114 DT 3 draws boxes between two start and end times each day. This modified program (Tutorial 114 DT4) adds text labels to the boxes, otherwise the functionality is the same as _Tutorial 114 DT 3.
The tutorial program uses the rectangle class with several of its properties and the create class. It also uses the TextLabel class. The tutorial demonstrates the creation of a method to create the rectangles, which is called from several places in the program. Tutorial 114 DT 4 creates five boxes at different price levels in each time zone.
See the tutorial pages:
Tutorial 114: https://markplex.com/free-tutorials/tutorial-114-drawing-rectangular-zones-chart/
Tutorial 114 DT3: https://markplex.com/free-tutorials/tutorial-114-dt-drawing-rectangles-chart-time-periods-day/
Tutorial 114 DT4: https://markplex.com/free-tutorials/tutorial-114-dt-drawing-rectangles-chart-time-periods-day/tutorial-114-dt-drawing-rectangles-chart-time-periods-day-2/
-
 2:07:26
Kim Iversen
6 hours agoFAFO: Trump's ‘Deport or Get Tariff’d’ Plan Worked | Did Trump Reveal The REAL Gaza Death Toll?
35.8K128 -
 LIVE
LIVE
Danny Polishchuk
11 hours agoDeportations Begin + Guest Jay Dyer | Low Value Mail Live Call In Show
1,640 watching -
 1:10:08
Donald Trump Jr.
8 hours agoWhat Real Leadership Looks Like, Live with Sen Bernie Moreno | TRIGGERED Ep.210
136K213 -
 1:38:57
Glenn Greenwald
6 hours agoWith Tulsi's Hearing this Week, Establishment Attacks her with Lies About Snowden & 702; U.S. Journalist Arrested in Switzerland for Criticizing Israel; China's Leap Forward in AI | SYSTEM UPDATE #397
66.3K80 -
 57:43
57:43
The StoneZONE with Roger Stone
3 hours agoWhat Will The JFK Assassination Files Reveal? | The StoneZONE w/ Roger Stone
26K8 -
 18:24
18:24
Tundra Tactical
6 hours ago $5.25 earnedWhats New With HRT Tactical Gear at SHOT Show 2025
45.6K6 -
 23:27
23:27
Rethinking the Dollar
6 hours agoWealth Protection SECRETS Learned from Wildfires w/ Paul Stone
57.9K7 -
 59:28
59:28
Flyover Conservatives
22 hours agoInsider Reacts to Trump’s 100 Hours: Davos, WHO, Climate Change, DEI… - Alex Newman | FOC Show
30.7K2 -
 1:04:30
Battleground with Sean Parnell
9 hours agoPresident Trump Is Flooding The Zone
119K11 -
 LIVE
LIVE
We Like Shooting
15 hours ago $0.53 earnedWe Like Shooting 595 (Gun Podcast)
167 watching