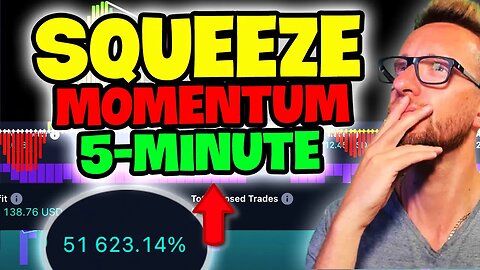
1 year agoThe BEST Indicator On TradingView: Squeeze Momentum Indicator Scalping StrategyDaviddTech Trading Strategies
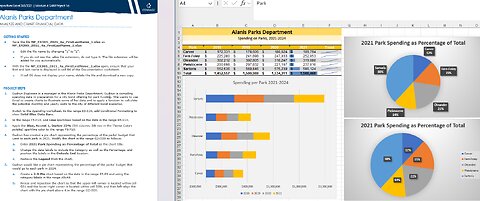
3 days agoNew Perspectives Excel 365/2021 | Module 4: SAM Project 1a | Alanis Parks Departmentsaxi753
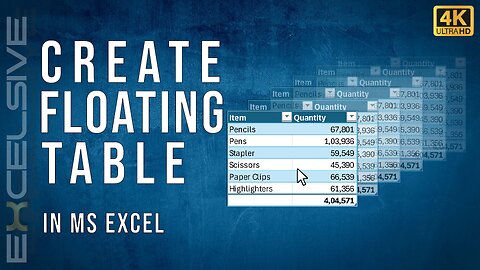
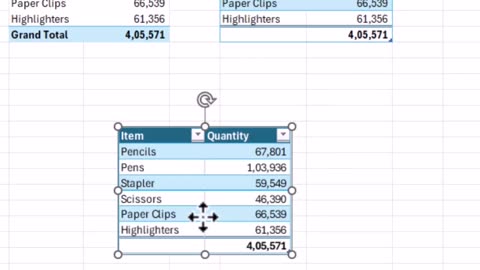
11 months agoDitch PivotTables! Self-Updating Excel Totals with Dynamic Image (Drag & Drop!)Excelsive
11 months agoDitch PivotTables! Self-Updating Excel Totals with Dynamic Image (Drag & Drop!)Excelsive
4 years agoMicrosoft Excel Tutorial for Beginners Part 1 Full Intro Learn How to Use ExcelSubjectmoney.com
2 years agoExcel Convert Formula -Everyone Must Know | Measurement is Easy in Excel - اردو / हिन्दीKhan Academy Of Computer Science And English Language
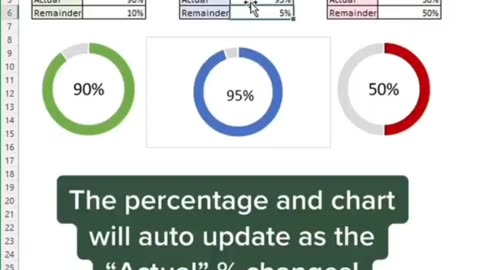
1 year agoHow to make a completion chart in under 60 secondsLevel up in Excel #ytshorts #excelKNOWLEDGEWITHALEX