Mastering Data Visualization: Creating Animated Charts in Excel
Title: "Mastering Data Visualization: Creating Animated Charts in Excel"
Description:
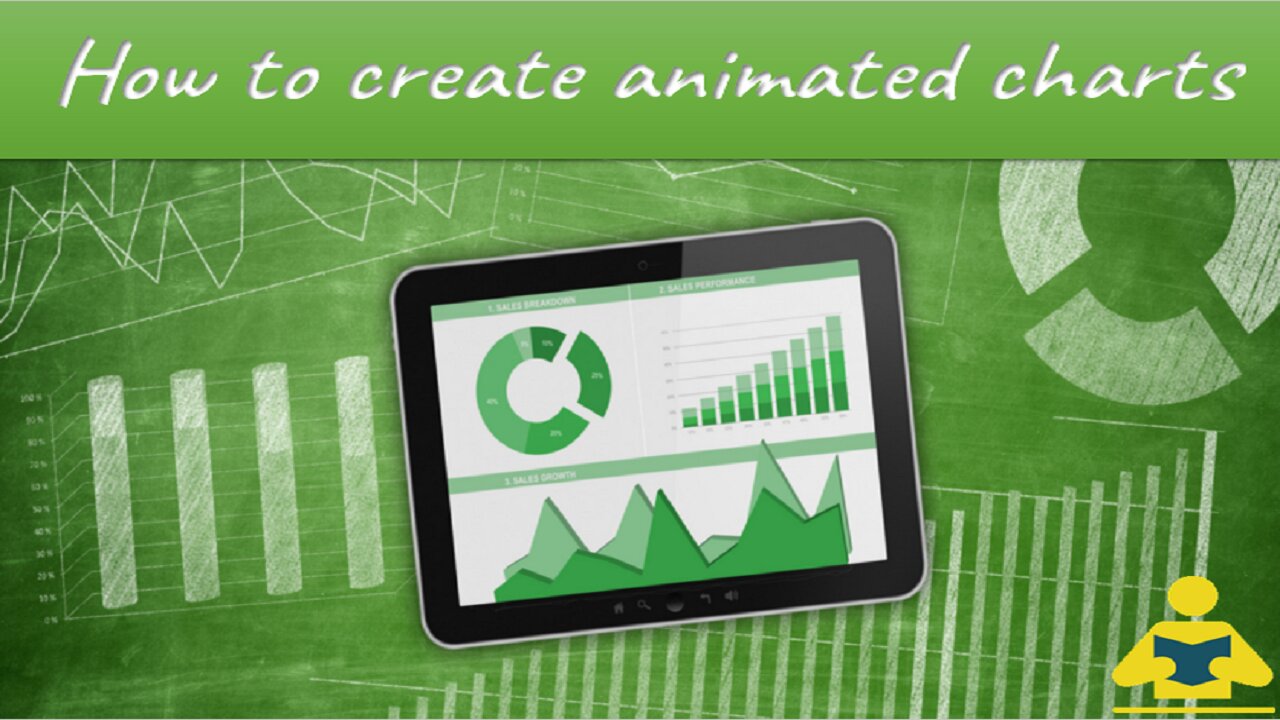
Welcome to our YouTube tutorial on unlocking the power of data visualization with Excel! 📊📈 In this comprehensive guide, we'll walk you through the exciting process of creating captivating animated charts that breathe life into your data presentations.
🎥 Watch as we break down the steps to transform your static charts into dynamic visual stories. Whether you're a business analyst, student, or simply curious about data representation, this tutorial is for you. No prior experience required!
Key Highlights:
Introduction to Animated Charts: Discover why animated charts are the next level of data visualization and how they can make your insights more impactful.
Choosing the Right Data: Learn the art of selecting data sets that work best for animated charts, and get tips on preparing your data for Excel.
Creating Basic Animations: Dive into the basics with step-by-step instructions on building animated bar graphs, line charts, and pie charts.
Advanced Animation Techniques: Elevate your skills with advanced techniques like data filtering, incorporating time-based animations, and adding interactive elements for a truly immersive experience.
Customization and Styling: Unleash your creativity by exploring Excel's formatting options to match your animated charts with your brand or project theme.
Exporting and Sharing: Once you've crafted your animated masterpiece, learn how to export and share it seamlessly, whether it's for a presentation, report, or social media.
🔗 Downloadable Resources:
Don't miss out on the downloadable templates and sample datasets we've provided in the video description. They'll help you follow along and practice as you watch!
🚀 Ready to bring life to your data? Hit that play button and let's dive into the world of animated charts together. Don't forget to like, subscribe, and ring the notification bell to stay updated on our latest tutorials. Let's make your data tell a story!
Please subscribe my other channels on youtube:
youtube.com/@withshaiby
youtube.com/@islamEasy000
-
 LIVE
LIVE
Lofi Girl
2 years agolofi hip hop radio 📚 - beats to relax/study to
2,531 watching -
 1:50:51
Adam Carolla
5 days ago $12.92 earnedDave Portnoy RAILS against entitled, lazy Gen-Z Workforce + Comedian Dusty Slay | Adam Carolla Show
46.3K30 -
 12:10
12:10
Talk Nerdy Sports - The Ultimate Sports Betting Podcast
4 hours ago4/20/25 - Easter Sunday Special: Vas Resurrects the Slip & Buries the Books 🧾🔥
23.2K4 -
 15:00
15:00
Mrgunsngear
19 hours ago $5.98 earnedDan Wesson DWX: 2011 & CZ-75's Baby
43.7K18 -
 16:07
16:07
SKAP ATTACK
17 hours ago $5.32 earnedNuggets STEAL Game 1 Behind Jokic Mastery
61.3K10 -

Big Fitz Plays
5 hours agoWho Gave Me a Chainsword?! | Space Marine 2 Chaos Stream
26.3K1 -
 22:16
22:16
marcushouse
19 hours ago $4.97 earnedFinally, the Starship Info We’ve Been Waiting For… And What We Can Do With It Is Wild!
51.1K19 -
 33:32
33:32
Ohio State Football and Recruiting at Buckeye Huddle
17 hours agoOhio State Football: What Position is the Biggest Question Mark for the Buckeyes?
41.4K2 -
 2:07:19
JahBlessGames
5 hours agoEASTER STREAM TEST
19.3K2 -
 9:30
9:30
VSOGunChannel
22 hours ago $2.05 earnedAdmin Actually Defending the 2nd Amendment?
29.9K11