3 months ago🎯False Breakouts Indicator - Fake Breakouts Failure in #Tradingview [#TradingFinder]tradingfinder
7 days ago💥 ICT Setup 03 Indicator - Judas Swing NY 9:30am + CHoCH/FVG in #Tradingview [#TradingFinder]tradingfinder
1 month ago📊 ICT KillZones + Pivot Points Indicator - Support/Resistance in #Tradingview [#TradingFinder]tradingfinder
3 months ago🎯Swing Failure Pattern SFP Indicator - SFP ICT Strategy in #Tradingview [#TradingFinder]📌tradingfinder
4 months ago🎯Smart Money Setup 06 indicator in #tradingview [#TradingFinder] Liquidity Sweeps + OB Swing🚀tradingfinder
4 years agoBITCOIN TRADING - Arguably The Best Bitcoin Trading strategy (MACD Indicator)FWisdomVerified
2 years ago🔴 The Only Momentum Trading INDICATOR You Will Ever Need Better than MACD 💪 💰 #SHORTS Stocks CryptoMuathe.com
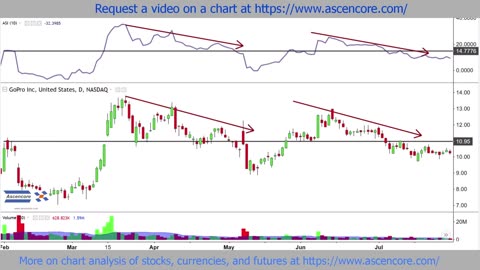
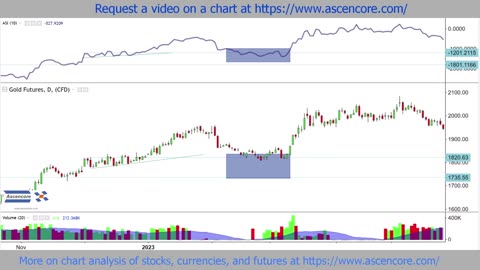
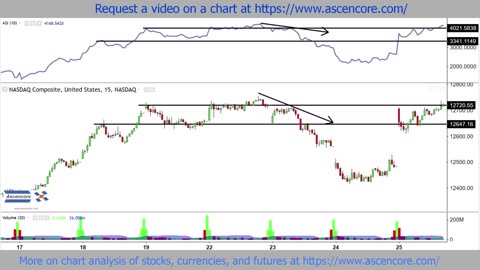
1 year agoNASDAQ Composite Stock Chart Accumulation Swing Index (ASI) Indicator Analysis ExampleAscencore
![🎯False Breakouts Indicator - Fake Breakouts Failure in #Tradingview [#TradingFinder]](https://1a-1791.com/video/fwe1/85/s8/1/6/6/G/1/66G1w.oq1b.2-small-False-Breakouts-Indicator-F.jpg)

![💥 ICT Setup 03 Indicator - Judas Swing NY 9:30am + CHoCH/FVG in #Tradingview [#TradingFinder]](https://1a-1791.com/video/fww1/ce/s8/1/p/J/h/C/pJhCy.oq1b.2-small--ICT-Setup-03-Indicator-Jud.jpg)
![📊 ICT KillZones + Pivot Points Indicator - Support/Resistance in #Tradingview [#TradingFinder]](https://1a-1791.com/video/fwe2/43/s8/1/-/T/0/o/-T0oy.oq1b.2-small--ICT-KillZones-Pivot-Points.jpg)
![🎯Swing Failure Pattern SFP Indicator - SFP ICT Strategy in #Tradingview [#TradingFinder]📌](https://1a-1791.com/video/fwe2/72/s8/1/H/s/a/Z/HsaZw.oq1b.2-small-Swing-Failure-Pattern-SFP-I.jpg)

![🎯Smart Money Setup 06 indicator in #tradingview [#TradingFinder] Liquidity Sweeps + OB Swing🚀](https://1a-1791.com/video/s8/6/_/T/4/p/_T4pv.oq1b.jpg)