Premium Only Content

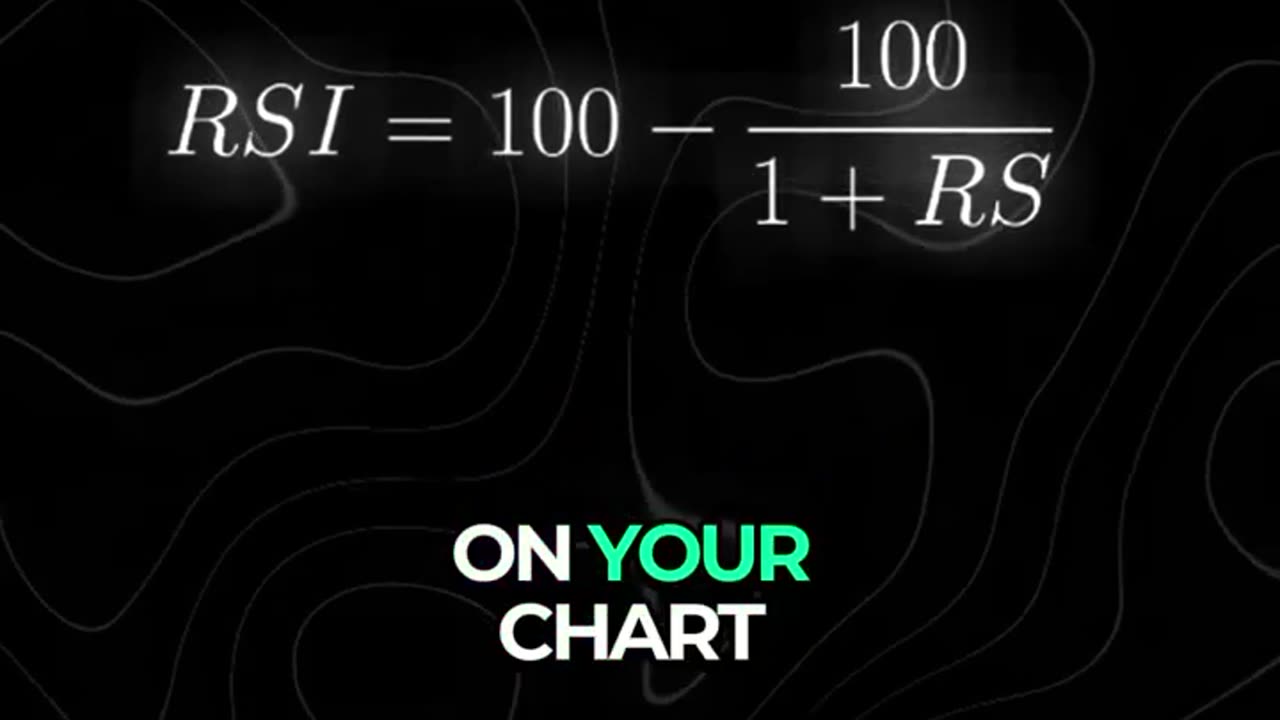
RSI Indicator - OOOOO
Reversal Patterns
A price pattern that signals a change in the prevailing trend is known as a reversal pattern. These patterns signify periods where the bulls or the bears have run out of steam. The established trend will pause, then head in a new direction as new energy emerges from the other side (bull or bear).
3
For example, an uptrend supported by enthusiasm from the bulls can pause, signifying even pressure from both the bulls and bears, then eventually give way to the bears. This results in a change in trend to the downside.
Reversals that occur at market tops are known as distribution patterns, where the trading instrument becomes more enthusiastically sold than bought. Conversely, reversals that occur at market bottoms are known as accumulation patterns, where the trading instrument becomes more actively bought than sold.
The longer the pattern takes to develop and the larger the price movement within the pattern, the larger the expected move once the price breaks out.
When a price reverses after a pause, the price pattern is known as a reversal pattern. Examples of common reversal patterns include:
Head and Shoulders, signaling two smaller price movements surrounding one larger movement
Double Tops, representing a short-term swing high, followed by a subsequent failed attempt to break above the same resistance level
Double Bottoms, showing a short-term swing low, followed by another failed attempt to break below the same support level
Pennants
Pennants are continuation patterns drawn with two trendlines that eventually converge. A key characteristic of pennants is that the trendlines move in two directions—one will be a down trendline and the other an up trendline. The figure below shows an example of a pennant. Often, the volume will decrease during the formation of the pennant, followed by an increase when the price eventually breaks out.
A bullish pennant is a pattern that indicates an upward trending price—the flagpole is on the left of the pennant.
Bullish pennant trading indicator
Image by Sabrina Jiang © Investopedia 2020
A bearish pennant is a pattern that indicates a downward trend in prices. In a bearish pattern, volume is falling, and a flagpole forms on the right side of the pennant.
Flags
Flags are continuation patterns constructed using two parallel trendlines that can slope up, down, or sideways (horizontal). Generally, a flag with an upward slope (bullish) appears as a pause in a down trending market; a flag with a downward bias (bearish) shows a break during an up trending market. Typically, the flag's formation is accompanied by declining volume, which recovers as price breaks out of the flag formation.
-
 LIVE
LIVE
Donald J. Trump
1 hour agoCommander-In-Chief Ball
8,007 watching -
 LIVE
LIVE
GOP
18 hours agoPresident Trump Speaks at the Commander-In-Chief Ball
1,005 watching -
 LIVE
LIVE
Glenn Greenwald
3 hours agoTrump is Inaugurated & Immediately Issues Executive Orders; Biden Pardons His Family, Liz Cheney, Fauci; Michael Tracey DC Interviews | SYSTEM UPDATE #392
7,068 watching -
 5:19:30
Donald J. Trump
7 hours agoDonald J. Trump Attends the Presidential Parade
469K533 -
 LIVE
LIVE
The Jimmy Dore Show
2 hours agoTrump Issues 200 Executive Orders On his First Day! Biden Goes Pardon-Crazy Right Up To The End!
18,509 watching -
 DVR
DVR
GOP
19 hours agoDonald J. Trump Attends the Presidential Parade
185K70 -
 11:51:52
Right Side Broadcasting Network
7 days agoLIVE REPLAY: Inauguration of the 47th President Donald Trump, and Presidential Parade - 1/20/25
1.1M561 -
 4:25:55
Kimberly Guilfoyle
6 hours agoLive Inauguration Day Coverage
99.7K23 -
 LIVE
LIVE
Benny Johnson
4 hours ago🚨 Watch President Trump FREE January 6th Political Prisoners LIVE Right Now | Stadium ROARS
25,290 watching -
 1:06:10
LFA TV
1 day agoThe Return of 45 | TRUMPET DAILY 1.20.25 7pm
21K