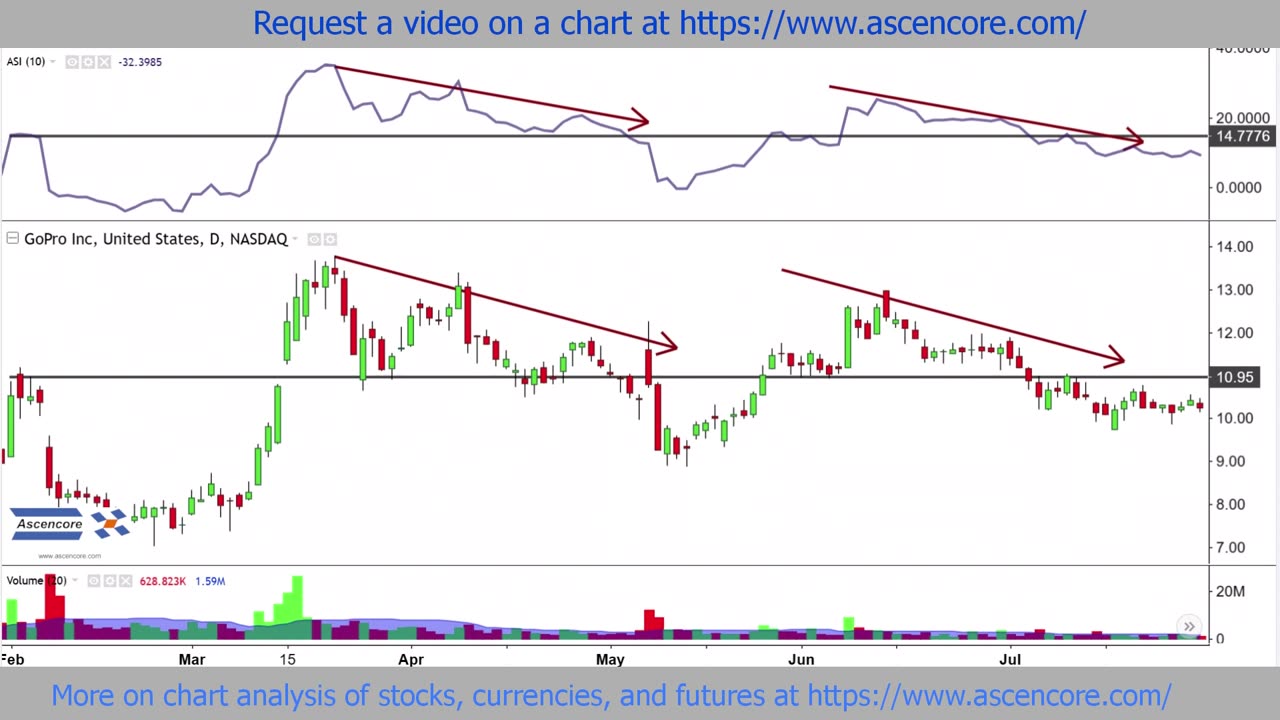
GPRO Stock Chart Accumulation Swing Index (ASI) Indicator Analysis Example
1 year ago
7
For more on trading, investing, charting analysis, and helpful information on the stock markets, currencies, and commodity markets, visit https://www.ascencore.com/
Full series on the Accumulative Swing Index (ASI) Indicator here: https://www.youtube.com/playlist?list=PL_KT4xihdLnarp1c7zMW2rItvTawnvZ0z
Loading comments...
-
 6:36
6:36
Ascencore
14 hours agoWhy People Bought Symbotic Inc | $SYM Stock #StocksToWatch #StockMarketNews
82 -
 13:24
13:24
EvenOut
10 hours agoMATRIX AGENTS TAKE OVER REALITY!
216 -
 11:27
11:27
Reforge Gaming
10 hours agoThe GTA 6 Problem
7981 -
 1:24:23
Kyle Rittenhouse Presents: Tactically Inappropriate
10 hours agoThe Lawman
7981 -
 10:36
10:36
Clownfish TV
9 hours agoMSNBC and Rachel Maddow NEED Trump to Stay in Business...
1.16K1 -
 4:10
4:10
PerpetualHealthCo
16 hours agoFDA Bans Red Dye No.3
1.02K -
 59:57
59:57
Trumpet Daily
19 hours ago $3.45 earnedRemembering Herbert W. Armstrong - Trumpet Daily | Jan. 16, 2025
3.88K6 -
 26:07
26:07
The Lou Holtz Show
12 hours agoThe Lou Holtz Show S 2 Ep 1 | Tony Rice on Championship Leadership and Notre Dame Legacy #podcast
1.35K -
 53:37
53:37
Weberz Way
12 hours agoGOODBYE JOE, TRUMPS CABINET, LA FIRES, & KEEP TIKTOK
1.46K -
 3:07:17
Alex Zedra
9 hours agoLIVE! New Game | Exorcism!??
31K4