1 year agoChatGPT 4 - Create Beautiful Graphs And Charts In Seconds - NO EXCEL REQUIRED - Daigr.amAI Solutions
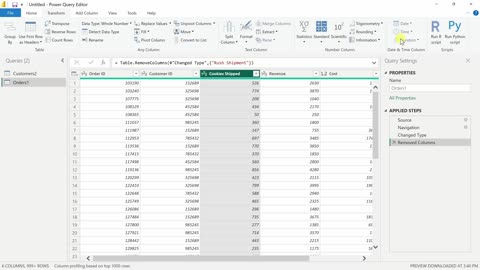
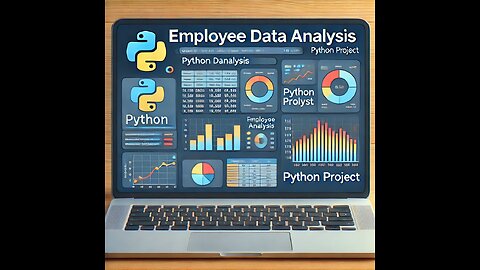
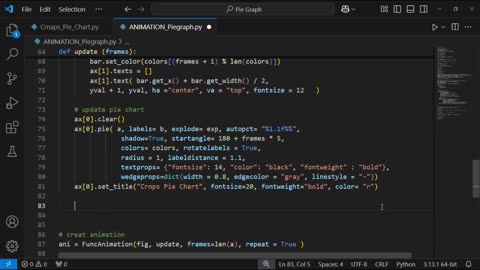
2 months agoProject Title Advanced Data Analysis and Visualization with Pandas and Matplotlibdamilolaadegunwa
1 year agoEasiest Excel Waterfall Chart (Bridge graph) from Scratch - Works with minus valuesLeila Gharani
1 year agoMicrosoft Excel: How to Improve your Charts & Tables for Better Communication - PromoLeila Gharani
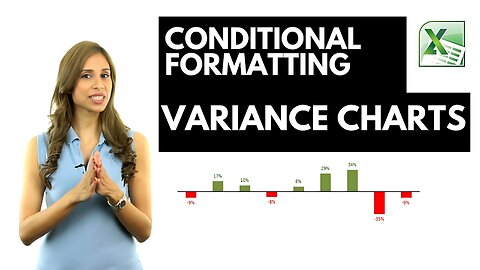
1 year agoBetter Excel Variance Charts to show percentage change (Simple & uncommon technique)Leila Gharani
1 year ago🔥⭐ Retable Review - App spreadsheets into smart database Excel you can safely share with your team🚀✨Miqbalblog
2 months agoProject Title: Advanced Data Analysis and Visualization with Pandas and Matplotlibdamilolaadegunwa