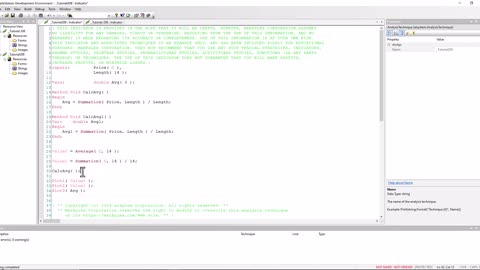
2 years agoQuickTip 74 | Finding the highest pivot on a chart | TradeStation EasyLanguage tutorialsMarkplex
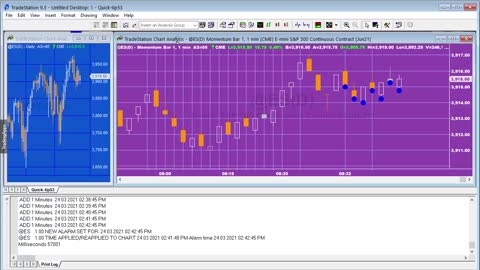
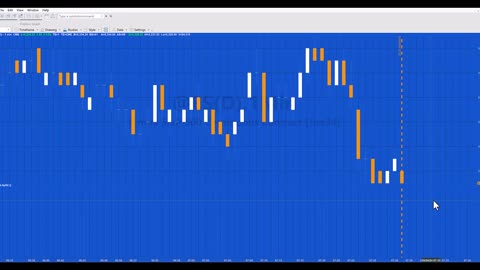
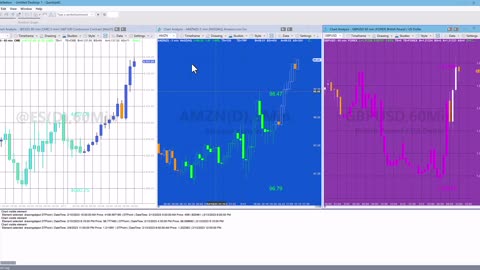
4 years agoQuick-tip 53 | How to modify tutorial 116 to reload the chart data at regular intervalsMarkplex
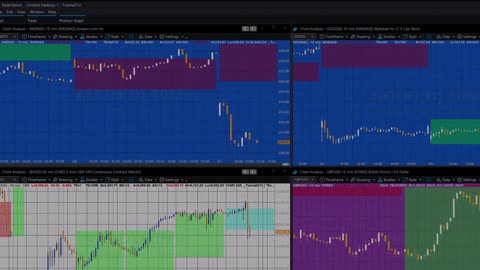
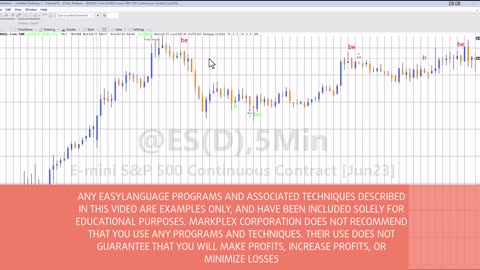
2 years agoTutorial 186 | Inside and outside bar high and low lines | TradeStation EasyLanguageMarkplex
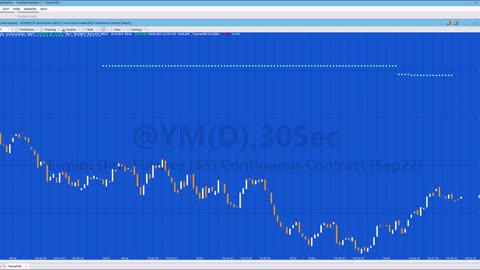
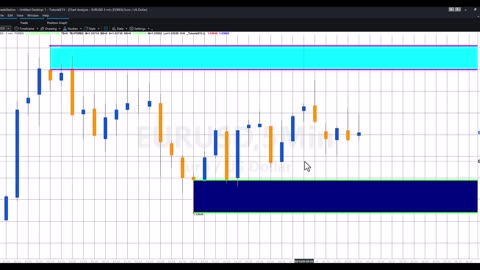
1 month agoTutorial 212 | Draw a rectangle on a chart each day between the high and low of the PREVIOUS dayMarkplex
3 years agoTradeStation QuickTip 71 Drawing a vertical line when there is a moving average crossoverMarkplex
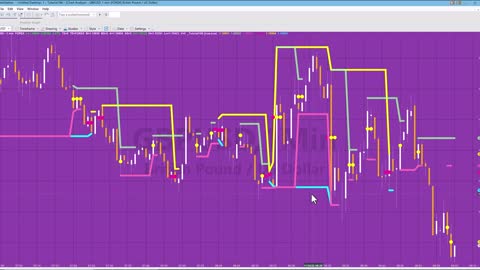
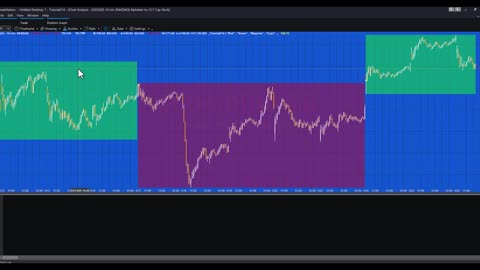
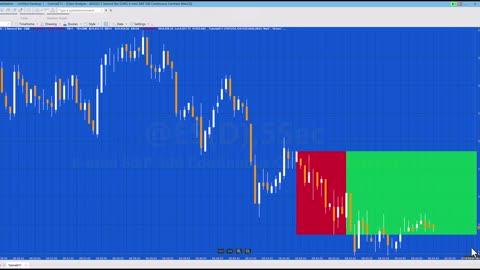
3 months agoTutorial 211 | Create a rectangle between 2 times and the highest/lowest price between those timesMarkplex
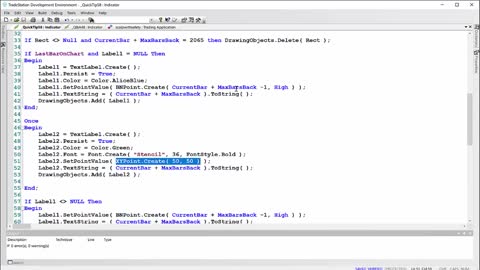
2 years agoTradeStation EasyLanguage Tutorial 187 | Draw text labels anchored to the right of the chartMarkplex