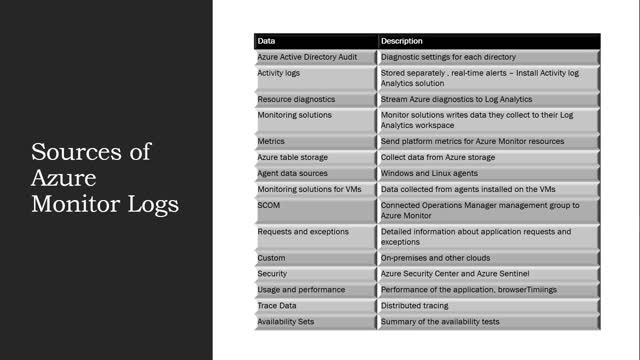
Azure Monitor Logs - Sources
There are many sources that can be the used with Azure Monitor.
Azure tenant and subscription
Azure Active Directory audit logs – You can compare your Azure AD sign-in logs against security logs published by Azure Security Center. It can be used for troubleshooting performance bottlenecks on your application’s sign-in page by correlating application performance data from Azure Application Insights.
You can route audit logs activity reports which give you access to the history of every task that's performed in your tenant. With the Sign-ins logs you can determine who performed the tasks that are reported in the audit logs.
Monitoring solutions write data they collect to their Log Analytics workspace. Monitoring solutions use services in Azure to gain knowledge of the operation of a particular application or service. It does this by collecting log data and providing queries, views to analyze the collected data.
You also add monitoring solutions to Azure Monitor for any application and services that you use. These are available at no cost but the collected data would incur a cost for usage.
Azure Resources
You can configure diagnostic settings to write to diagnostic data, including metrics to a Log Analytics workspace.
You can send platform metrics for Azure Monitor resources to a Log Analytics workspace to retain the log data for a longer period of time. This would for instances of regulatory compliance and corporate standards.
Also to provide data for historical purposes for data analysis.
You can also store the data in Azure storage when you can write it to data tables. This is using Azure CosmoDB n the backend. Azure CosmoDB is NoSQL solution and uses name-value pairs instead of relational configuration such as SQL or MySQL etc.
Virtual Machines
Data is stored from Windows and Linux agents included events, performance data and custom logs.
We can also send this data over to Monitoring solutions (SIEMs)
This data can be collected using SCOM using management groups to collect event and performance data from on-premises agents into logs.
Applications
Detailed information about application requests and exceptions are in the requests, browserTimings and performanceCounters tables. Also calls to external components are in the dependencies.
Performance information from the application is also available in the requests, browserTimings and performaceCounters tables. Data for custom metrics is in the customMetrics table.
We can capture data from distributed traces , these will be stored in the traces table. This is the equivalent of call stacks for modern cloud computing and microservices architectures with the addition of a simplistic performance profiler. There are two ways to use distributed traces.
You can sue transaction diagnostics which is the call stack with a time dimension added in. This gives you a view into the individual transactions and is helpful for finding the root cause of reliability issues and performance bottlenecks on a per request basis. The other view is the application map. This view aggregates many transactions to show a topological view of how the systems interact, and what the average performance and error rates are.
Aksi we have summary data that is exposed about availability information. This is stored in the availability Results table. This gives you a detailed data from these tests in a separate storage and accessed from Application Insights in the Azure portal.
Insights
Another area that we can get data is from the container instances. We can collect insights into the performance of the containers. We will talk abou tcontiners later in the course.
We can also collect data from the VM itself and get insights on how the VM is behaving. This is for both VMs and also Virtual Machine Scale Sets. It analyzes the performance and health of your Windows and Linux VMs. It also monitor their processes and dependencies on other resources and external processes. It includes support for monitoring performance and application dependencies for VMs that are hosted on-premises or in another cloud provider.
You have the Pre-defined trending performance charts which display the core performance metrics from the quest VM OS. We also have the dependency map that shows the interconnected components with the VM from various resource groups and subscriptions.
Custom
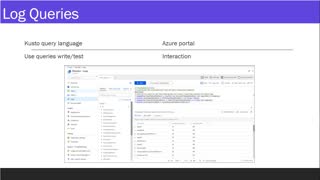
You can write data to a Log Analytics workspace form any REST client. You can use the HTTP Data Collector API to send log data to a Log Analytics workspace in Azure Monitor from any client that can call a REST API. This can be from a runbook in Azure Automation that collects management data from Azure or another cloud. It could also be an alternate management system that use Azure Monitor to consolidate and analyze log data. All of this data is stored a s record with a particular record type.
You format your data to send to the HTTP Data Collector API as multiple records in JSON. When you submit the data , an individual record is created in the repository for each record in the request payload.
You can also redirect the data to a Azure Logic App workflow. This is a serverless resource with in Azure which allow you to create decision trees. It is similar to Flow in M365. There are 200_ connector that you can use with Logic Apps. They are covered more in the AZ-300 / AZ-400 exams.
Security
Security information is stored in the Azure Security Center , it collects in a Log Analytics workspace where it can be analyzed with other log data. Security center collects data from the Azure resources and also non-Azure resourc3es to monitor security vulnerabilities and threats. Data is collected using Log Analytics agent, which reads various security-related configurations and event logs from the machine and copies the data to your workspace for analysis. Data collection is required to provide visibility into missing updates, misconfigurations of the OS security settings, endpoint protection status and threat protection.
Another tool that we have in our arsenal is Azure Sentinel. This a scalable , cloud-naitve SIEM (SCSM) and security orchestration automated response (SOAR) solution. It delivers intelligent security analytics and threat intelligence across the enterprise, providing a single solution for alert detection, threat visibility, proactive hunting and threat response. It gives you a pane of glass look over your entire environment helping you thwart cyber attacks within the enterprise. It collects data at cloud scale, detects previously undetected threats, investigates threats with AI and responds to incidents rapidly.
We cover this and a lot more in this video.
-
 5:50
5:50
ideadudes
3 years agoAzure Monitor - Logs / Uses and Configuration
45 -
 5:56
5:56
ideadudes
3 years agoAzure Monitor Basics
119 -
 6:05
6:05
ideadudes
3 years agoAzure Monitor - Metrics Overview
17 -
 4:40
4:40
ideadudes
3 years agoAzure Monitor - Metrics Uses and Configuration
78 -
 5:07
5:07
Performing in an Academic Environment
4 years ago $0.12 earnedAcademic Sources
157 -
 20:26
20:26
dwtwo
4 years agoMonitor repair
198 -
 1:51
1:51
flopearedmule
3 years ago $0.01 earnedMonitor style steam engine
111 -
 0:08
0:08
Hole in the Ground Productions
4 years agoHungry Computer Monitor
1171 -
 0:25
0:25
ViralHog
3 years ago $0.01 earnedMonitor Lizard Lays on Motor
3012 -
 0:15
0:15
toksfale
4 years ago $1.04 earnedMainstream media sources
2.15K4