Premium Only Content

THIS Stock Market Rally ENDS on Friday 👀
🟢 BOOKMAP DISCOUNT (PROMO CODE "BM20" for 20% off the monthly plans): https://bookmap.com/members/aff/go/figuringoutmoney?i=79
🟢 TRADE IDEAS & DISCORD: https://www.patreon.com/figuringoutmoney
🟢 TRADE WITH IBKR: http://bit.ly/3mIUUfC
___________________________________________________________________________________________
In this video, we explore market seasonality and the Consumer Price Index (CPI) to predict a potential end to the current rally on Friday.
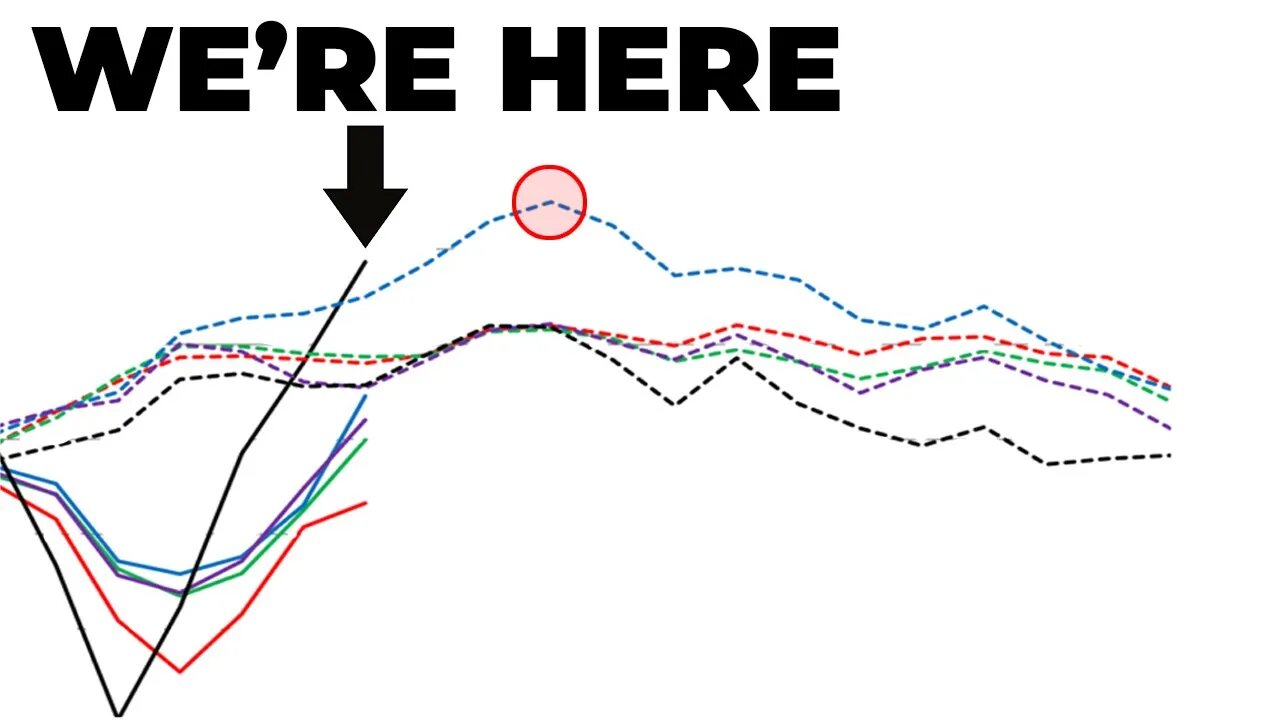
We start by examining July's market trends, noting a peak around the eighth trading day. This pattern, often seen in pre-election years and in the NASDAQ, hints at a possible market pivot.
Next, we discuss the recent CPI report. Initially, the market surged as the report was lower than expected, but later began to sink. Interestingly, utilities, a rate-sensitive sector, led the way, possibly due to a significant decrease in two-year and ten-year rates post-CPI report.
We also touch on inflation data, which came in at 3% year over year, lower than the consensus and the CPI nowcast by the Federal Reserve. This underperformance was perceived positively by the market.
The Fed Watch tool suggests a 94% chance of a rate hike in the July meeting, but a decreased probability for September, indicating a potential pause in rate hikes.
Lastly, we highlight the significant drop in the dollar and its impact on various sectors. We also discuss the S&P 500 and the NASDAQ, both trading outside of their weekly expected moves. However, the big mega cap names, which have a large weighting in the S&P 500 and NASDAQ 100, have not moved outside of their expected moves, which could potentially alleviate the market even if some products fall.
In conclusion, while signs of a potential market pivot are emerging, it's crucial to monitor the big mega cap names and be prepared for various scenarios. Stay tuned for more updates!
🔔 Subscribe now and never miss an update: https://www.youtube.com/c/figuringoutmoney?sub_confirmation=1
📧 For business inquiries or collaboration opportunities, please contact us at FiguringOutMoney@gmail.com
📈 Follow us on social media for more insights and updates:
🟢 Instagram: https://www.instagram.com/figuringoutmoney
🟢 Twitter: https://twitter.com/mikepsilva
______________________________________________________________________________________________
How To Predict How Far Stocks Can Go (EXPECTED MOVES):
○ https://youtu.be/JT32L89ZpEk
Saylor To Schiff Bitcoin Indicator:
○ https://youtu.be/zuG9Tjnud9k
Show Me The Money Scan:
○ https://youtu.be/dzRjEuUUb5g
Party Starter Scan:
○ https://youtu.be/zzaN91gcJOI
Bouncy Ball Scan:
○ https://youtu.be/7xKOo6vNaq8
Dark Money Scan:
○ https://youtu.be/ZUMuHaSg1ro
Sleepy Monster Scan:
○ https://youtu.be/C9EQkA7uVU8
High Volatility Scan:
○ https://youtu.be/VC327ko8DfE
______________________________________________________________________________________________
DISCLAIMER: I am not a professional investment advisor, nor do I claim to be. All my videos are for entertainment and educational purposes only. This is not trading advice. I am wrong all the time. Everything you watch on my channel is my opinion. Links included in this description might be affiliate links. If you purchase a product or service with the links that I provide I may receive a small commission. There is no additional charge to you! Thank you for supporting my channel :)
#Stockmarket #StockMarketAnalysis #DayTrading
#CPIReport
#Macroeconomics
#MarketAnalysis
#ImpliedVolatility
#SPY
#QQQ
#IWM
#TechnicalAnalysis
#TradeIdeas
#Investing
#Trading
#StockMarket
#FinancialNews
-
 20:11
20:11
Figuring Out Money
1 year agoLet's Get Ready To Rumble!
32 -
 4:16:41
CatboyKami
5 hours agoStalker 2 Blind playthrough pt1
6.7K1 -
 1:06:27
Russell Brand
5 hours agoNeil Oliver on the Rise of Independent Media, Cultural Awakening & Fighting Centralized Power –SF498
171K245 -
 1:39:14
vivafrei
5 hours agoSoros Karma in New York! Tammy Duckwarth Spreads LIES About Tulsi Gabbard! Pennsylvania FLIPS & MORE
80.1K62 -
 1:57:36
The Charlie Kirk Show
4 hours agoInside the Transition + The Bathroom Battle + Ban Pharma Ads? | Rep. Mace, Tucker, Carr | 11.21.24
129K50 -
 59:20
59:20
The Dan Bongino Show
7 hours agoBitter CNN Goes After Me (Ep. 2375) - 11/21/2024
850K3.42K -
 57:28
57:28
TheMonicaCrowleyPodcast
2 hours agoThe Monica Crowley Podcast: Mandate into Action
16K -
 1:02:09
TheAlecLaceShow
5 hours agoGuests: Alex Marlow & Terry Schilling | Justice For Laken Riley | Russian ICBM | The Alec Lace Show
31K8 -
 1:51:15
Danny Haiphong
4 hours ago $10.82 earnedMARK SLEBODA & SCOTT RITTER: NATO ATTACKS RUSSIA, PUTIN FIRES ICBM WARNING SHOT AT UKRAINE—WW3 NEXT?
74.9K12 -
 40:47
40:47
Dave Portnoy
8 hours agoThe Unnamed Show With Dave Portnoy, Kirk Minihane, Ryan Whitney - Episode 37
55.8K2