Premium Only Content

Get A Closer Look At This Stock Market Rally!
🟢 TRADE IDEAS & DISCORD: https://www.patreon.com/figuringoutmoney
🟢 EARN A $50,000 FUNDED ACCOUNT for $49: http://tracking.topsteptrader.com/SHZS
🟢 GREAT BROKERAGE ACCOUNT: http://bit.ly/3mIUUfC
🟢 TODAY'S CHART DECK: https://www.slideshare.net/MichaelSilva144/stock-market-brief-deckpdf-a391
🟢 BOOKMAP DISCOUNT (PROMO CODE "BM20" for 20% off the monthly plans): https://bookmap.com/members/aff/go/figuringoutmoney?i
__________________________________________________________________________________________
In tonights video, I analyze the performance of various financial markets, providing insights and commentary on recent trends and potential implications for investors. The video covers a range of topics, including stock market performance, commodity prices (specifically, oil and copper), currency exchange rates (the dollar), bond yields, and market indicators (such as the put-to-call ratio and the Smart Money vs. Dumb Money indicator).
The presenter starts by discussing how the market performed, highlighting that technology and the NASDAQ composite led the way. They emphasize the performance of consumer discretionary and technology sectors, particularly in mega-cap names. However, they also note that energy stocks faced significant declines, which could be indicative of economic sensitivity and concerns about a potential recession.
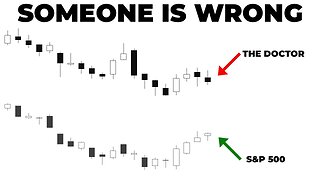
The video dives into technical analysis, referencing moving averages and chart patterns to assess the outlook for various assets, including oil, the S&P 500, and copper. The presenter suggests that certain indicators may point to future market moves, such as divergences between copper and the S&P 500.
Additionally, the video explores the relationship between the dollar's value and stock market performance, highlighting historical correlations and the impact of recent dollar movements on the S&P 500.
The presenter also touches on bond market volatility and the yield curve, discussing the potential implications for different asset classes and the overall market.
Towards the end of the video, the presenter introduces tools like the Put-to-Call Ratio and the Smart Money vs. Dumb Money indicator to evaluate market sentiment and potential turning points. They offer insights into the current state of these indicators and their historical significance.
Lastly, the video provides key levels and support/resistance levels for the S&P 500, shedding light on potential price targets and areas to watch in the coming days.
Overall, this video offers a comprehensive analysis of financial markets, helping viewers gain a better understanding of recent market movements and potential future developments. It serves as a valuable resource for those interested in stock market analysis and trading strategies.
🔔 Subscribe now and never miss an update: https://www.youtube.com/c/figuringoutmoney?sub_confirmation=1
📧 For business inquiries or collaboration opportunities, please contact us at FiguringOutMoney@gmail.com
📈 Follow us on social media for more insights and updates:
🟢 Instagram: https://www.instagram.com/figuringoutmoney
🟢 Twitter: https://twitter.com/mikepsilva
______________________________________________________________________________________________
How To Predict How Far Stocks Can Go (EXPECTED MOVES):
○ https://youtu.be/JT32L89ZpEk
Saylor To Schiff Bitcoin Indicator:
○ https://youtu.be/zuG9Tjnud9k
Show Me The Money Scan:
○ https://youtu.be/dzRjEuUUb5g
Party Starter Scan:
○ https://youtu.be/zzaN91gcJOI
Bouncy Ball Scan:
○ https://youtu.be/7xKOo6vNaq8
Dark Money Scan:
○ https://youtu.be/ZUMuHaSg1ro
Sleepy Monster Scan:
○ https://youtu.be/C9EQkA7uVU8
High Volatility Scan:
○ https://youtu.be/VC327ko8DfE
______________________________________________________________________________________________
DISCLAIMER: I am not a professional investment advisor, nor do I claim to be. All my videos are for entertainment and educational purposes only. This is not trading advice. I am wrong all the time. Everything you watch on my channel is my opinion. Links included in this description might be affiliate links. If you purchase a product or service with the links that I provide I may receive a small commission. There is no additional charge to you! Thank you for supporting my channel :)
#Stockmarket #StockMarketAnalysis #DayTrading
-
 7:24
7:24
Figuring Out Money
1 year agoMomentum Slowing, Divergences Growing: What Does This Mean For The Markets?
41 -
 LIVE
LIVE
The Shannon Joy Show
4 hours ago🔥🔥While Americans Are Watching WWE Politics: Australia Is Ramping Up MANDATORY Digital ID🔥🔥
442 watching -
 LIVE
LIVE
LFA TV
14 hours agoTHE FIGHT IN ONLY BEGINNING! | LIVE FROM AMERICA 11.21.24 11am EST
5,768 watching -
 1:18:10
Graham Allen
4 hours agoPutin Vows Peace With Trump But WAR Under Biden!! + 400,000 Kids Are MISSING?!
74.4K161 -
 2:11:07
Matt Kohrs
12 hours agoMSTR Squeezes Higher, Bitcoin To $100k & Nvidia Post Earnings || The MK Show
30.3K1 -
 42:07
42:07
BonginoReport
6 hours agoNikki Haley's Hatred of Tulsi Gabbard Just Made Me a Bigger Fan (Ep.90) - 11/21/24
78.2K194 -
 28:41
28:41
Professor Nez
11 hours ago🚨BLOOD on their HANDS! The Man Biden & Kamala Flew In Finally Faces JUSTICE for Laken Riley
37.6K26 -
 1:06:27
2 MIKES LIVE
3 hours agoThe Mike Schwartz Show 11-21-2024
37.1K -
 15:07
15:07
PMG
13 hours ago $1.14 earned"President Trump's Cabinet is Amazing!"
44.9K -
 LIVE
LIVE
Vigilant News Network
16 hours agoHeavily-Vaxxed County Faces Grim Reality | The Daily Dose
928 watching