Premium Only Content

Short Term Breadth & Sentiment Indicators Suggest Bullish Move For The Stock Market Into Election
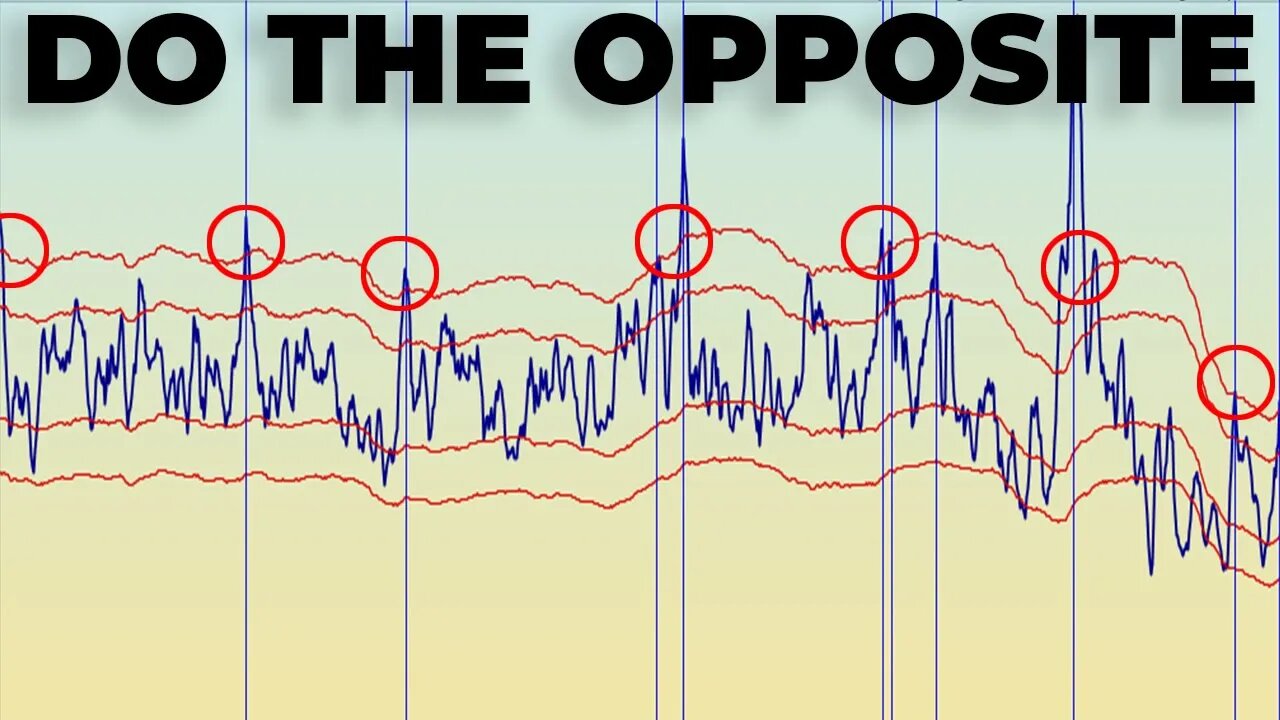
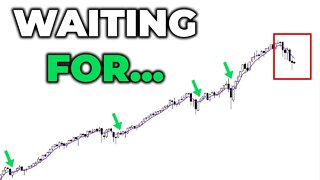
These Stock Market Breadth & Sentiment indicators suggest a short term move to the upside into the presidential election. Will doing the opposite of what the retail traders are doing work out this time around? History suggest that that equity traders are typically wrong when these stock market indicators hit extreme levels.
In the stock market daily brief I use technical analysis to help better understand where the stock market might be heading next. I analyze SP500, Nasdaq 100, Dow Jones, Russell 2000, various stock market indicators, commodities, yields and the US Dollar.
STOCK MARKET BIG PICTURE:
https://youtu.be/VAxxvFv-VzI
STOCK TRADING PLATFORM I USE
○ Webull (GET 2 FREE STOCKS): https://bit.ly/3i5U591
MY FAVORITES - https://amz.run/3JLv
○ Book Recommendations
○ My Studio Setup
○ Morning Coffee
COME SAY HI:
Instagram: https://www.instagram.com/figuringoutmoney
Twitter: https://twitter.com/mikepsilva
Make sure to SUBSCRIBE to my channel!
DISCLAIMER: I am not a professional investment advisor, nor do I claim to be. All my videos are for entertainment and educational purposes only. This is not trading advice. I am wrong all the time. Everything you watch on my channel is my opinion. Links included in this description might be affiliate links. If you purchase a product or service with the links that I provide I may receive a small commission. There is no additional charge to you! Thank you for supporting my channel :)
-
 11:07
11:07
Figuring Out Money
1 year agoGet A Closer Look At This Stock Market Rally!
57 -
 16:19
16:19
Figuring Out Money
2 years ago $0.09 earnedI'm NOT Bullish Until THIS... | Stock Market Analysis
213 -
 13:35
13:35
Figuring Out Money
2 years agoUntrustworthy Stock Market Bounce Despite Bullish Signals | Proceed With Caution
19 -
 15:25
15:25
Figuring Out Money
3 years agoStock Market Sentiment Gets VERY Bearish
11 -
 5:31
5:31
Rob Almasi
2 years agoStock Market Today
542 -
 0:35
0:35
Master Lama Rasaji
2 years agoConfidence In Stock Market?
42 -
 LIVE
LIVE
Grant Stinchfield
1 hour agoAs the Media Attacks Kash Patel, Have They Ever Listened to Him?
602 watching -
 LIVE
LIVE
Jesús Enrique Rosas
1 hour agoEp. 34: Biden gives ONE BILLION to AFRICA, Pete Hegseth under ATTACK, and MOAR!
354 watching -
 UPCOMING
LetsTalkNumbers
15 minutes agoLet's Talk Numbers S1 E8
-
 1:00:54
The Dan Bongino Show
3 hours agoMedia Goons Try To Kavanaugh Pete Hegseth (Ep. 2382) - 12/04/2024
502K1.93K