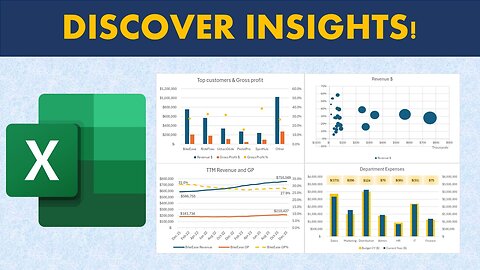
1 year agoExcel Arrow Variance Chart: Dynamic Arrows in Chart to Show Change to Previous Year / BudgetLeila Gharani
1 year agoAI signals vs. human intuition: Decision-making in crypto trading - CointelegraphBest Product Reviews
1 year agoBetter Excel Variance Charts to show percentage change (Simple & uncommon technique)Leila Gharani
1 year agoExcel 2016 Waterfall Chart - Advantages and Limitations - Ultimate guide to Excel's Bridge GraphLeila Gharani
1 year agoMicrosoft Excel Tutorial for Beginners | Excel Training | FREE Online Excel courseCreative World
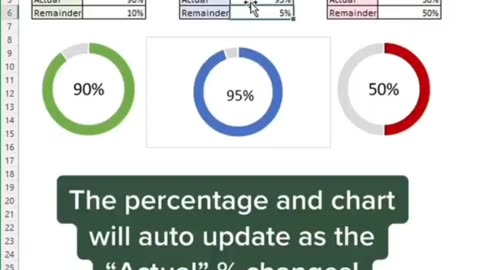
1 year agoHow to make a completion chart in under 60 secondsLevel up in Excel #ytshorts #excelKNOWLEDGEWITHALEX