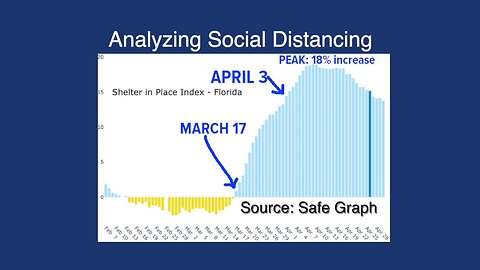
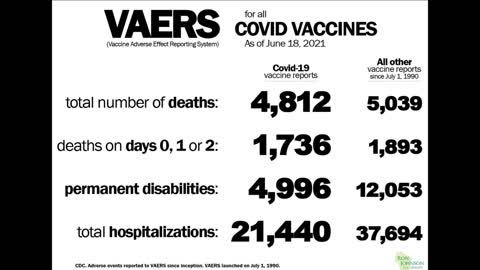
2 years agoVAERS (Vaccine Adverse Effects Reporting System) Graph Representation of DatasetsKeystonetrade.ca - News ArchiveVerified
11 months agoGraph symmetries crash course (x-axis, y-axis, origin)… fast and simple!Math Shorts with Caveman Chang
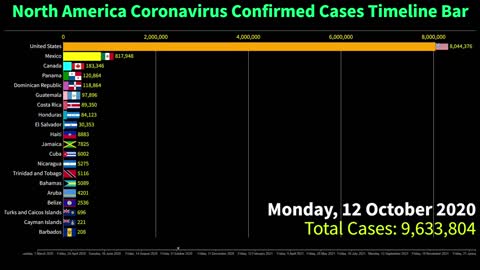
3 years agoTop 20 American Countries by Total COVID-19 Cases Timeline Bar | 31st January 2022 Coronavirus Graphfunny and comedy
1 year agoStock market abstract finance background with motion graph, chart b. Global business analyzingfun