Premium Only Content
This video is only available to Rumble Premium subscribers. Subscribe to
enjoy exclusive content and ad-free viewing.

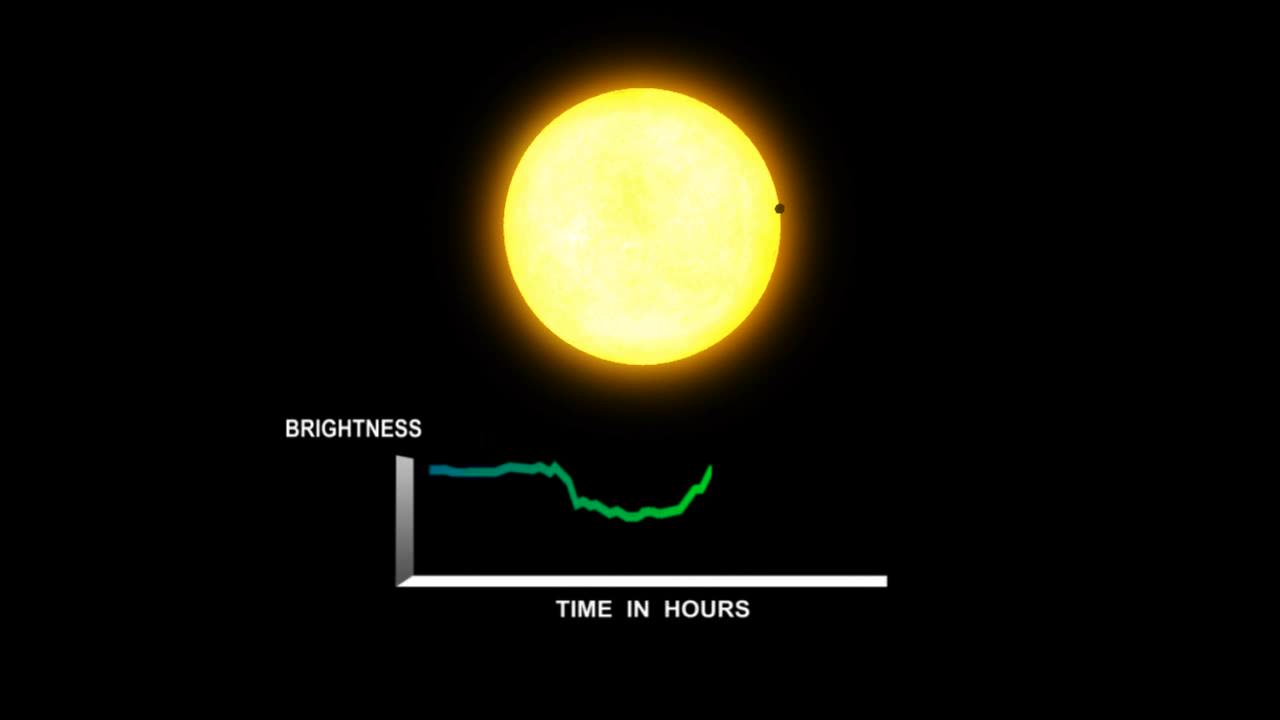
Transit Graph: Mapping Time and Brightness| 4K
1 year ago
5
Transit Graph
Time and Brightness
Data Visualization
Celestial Patterns
Luminance Analysis
Astronomical Insights
Visual Data
Celestial Phenomena
Light and Shadow
Observational Data
Explore the dynamic relationship between time and brightness through the captivating visual of a transit graph. Witness the ebb and flow of data as it charts the changing luminance over time, revealing patterns and insights. Immerse yourself in the dance of light and shadow that paints a vivid picture of celestial phenomena.
Loading comments...
-
 LIVE
LIVE
IrishBreakdown
2 hours agoNotre Dame Getting More Freshman Reinforcements - IB Top 25 Rankings
104 watching -
 LIVE
LIVE
The Charlie Kirk Show
1 hour agoStephen Miller Wrecks the Press + Replacing Mitch McConnell | Morris, Peterson, Bessent | 5.1.25
3,972 watching -
 1:10:28
The Rubin Report
3 hours agoDave Rubin & Ro Khanna Debate: Trump's 1st 100 Days & Are Judges Above the Law?
36.8K74 -
 LIVE
LIVE
Flyover Conservatives
12 hours agoLive Q&A - Dementia, Alzheimers, Memory Loss and Brain Health - Dr. Bryan Ardis | FOC Show
701 watching -
 LIVE
LIVE
The Shannon Joy Show
2 hours ago🔥🔥The Setup Is Over - Economic Detonation Begins And The UNIPARTY Is Stepping On the Gas - With Special Guest David Knight!🔥🔥
309 watching -

Benny Johnson
2 hours ago🚨 Tulsi Gabbard Investigating Dr. Fauci For PURJURY Over GAIN of Function, JAIL? | Kamala Returns!
59.9K40 -
 LIVE
LIVE
Major League Fishing
2 days agoLIVE! - Bass Pro Tour: Stage 4 - Day 1
572 watching -
 LIVE
LIVE
The Dana Show with Dana Loesch
1 hour agoKAMALA HARRIS: RETURN OF THE CACKLE | The Dana Show LIVE on Rumble! THURSDAY MAY 5TH 2025
443 watching -
 1:05:39
Blockchain Basement
2 hours ago $0.13 earned🚨Bitcoin 2026 Price TARGET! (Solana And Base SKYROCKETS!)
5.63K -
 LIVE
LIVE
NEWSMAX
4 hours agoThe Rob Carson Show LIVE (05/01/2025) | Call 1-800-922-6680 | NEWSMAX Podcasts
312 watching