Premium Only Content
This video is only available to Rumble Premium subscribers. Subscribe to
enjoy exclusive content and ad-free viewing.

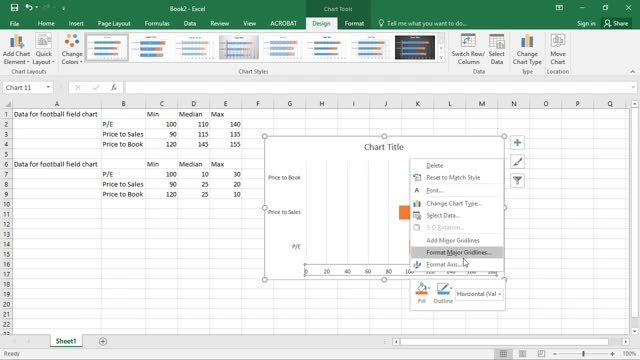
How to Make a Football Field Chart in Excel
2 years ago
13
A football field chart is a really nice way to visually display a range of valuations for a company or investment opportunity. It is super useful to demonstrating consistency in valuation methods and that you’ve thought about how sensitive your valuation is to different assumptions (i.e., a sensitivity analysis). Unfortunately, putting together a football field chart is kind of tricky. This video is a super basic example of how to get started making a football field chart. The final chart is not formatted well, but the point is just to give you a jumping off point to making a proper football field chart.
Loading comments...
-
 1:27:39
Man in America
14 hours agoBig Pharma's Deadliest Lie is Being EXPOSED to the Masses w/ Jonathan Otto
93.2K38 -
 1:40:08
Precision Rifle Network
1 day agoS4E2 Guns & Grub - Training Vs. Competition
46.7K2 -
 58:27
58:27
Flyover Conservatives
1 day agoGarrett Ziegler Breaks Down Special Councilor’s Report on Hunter Biden. Insights for Trump’s Top Picks. | FOC Show
71.5K6 -
 44:54
44:54
Steve-O's Wild Ride! Podcast
18 hours ago $11.24 earnedMark Wahlberg Threatened To Beat Up Jackass Cast Member - Wild Ride #251
119K13 -
 1:13:34
Josh Pate's College Football Show
12 hours ago $2.78 earnedCFB Dynasties & Villains | Marcus Freeman OR Ryan Day | 2025 Sleeper Teams | Cole Cubelic Joins
41.6K -
 1:00:26
The StoneZONE with Roger Stone
10 hours agoSHOCKING NEW TAPE PROVES LBJ KILLED JFK! | The StoneZONE w/ Roger Stone
62.2K28 -
 1:44:33
ObaTheGreat
12 hours agoCrypto vs The World w/ Oba The Great And YaBoySkey
46.5K5 -
 4:39:55
VOPUSARADIO
2 days agoPOLITI-SHOCK! "COUNTDOWN TO TRUMP" & THE GLOBALISTS BURNING IT ALL DOWN..LITERALLY!
20.9K2 -
 44:34
44:34
Kimberly Guilfoyle
15 hours agoCountdown to Inauguration Day, Plus California in Crisis, Live with Joel Pollack & Roger Stone | Ep. 189
134K58 -
 1:32:41
Redacted News
15 hours agoBiden's 'SNEAKY' plot to slow down Trump REVEALED | Redacted w Clayton Morris
148K253