Omicron Endemic True Number of Infections and Fatality Rate
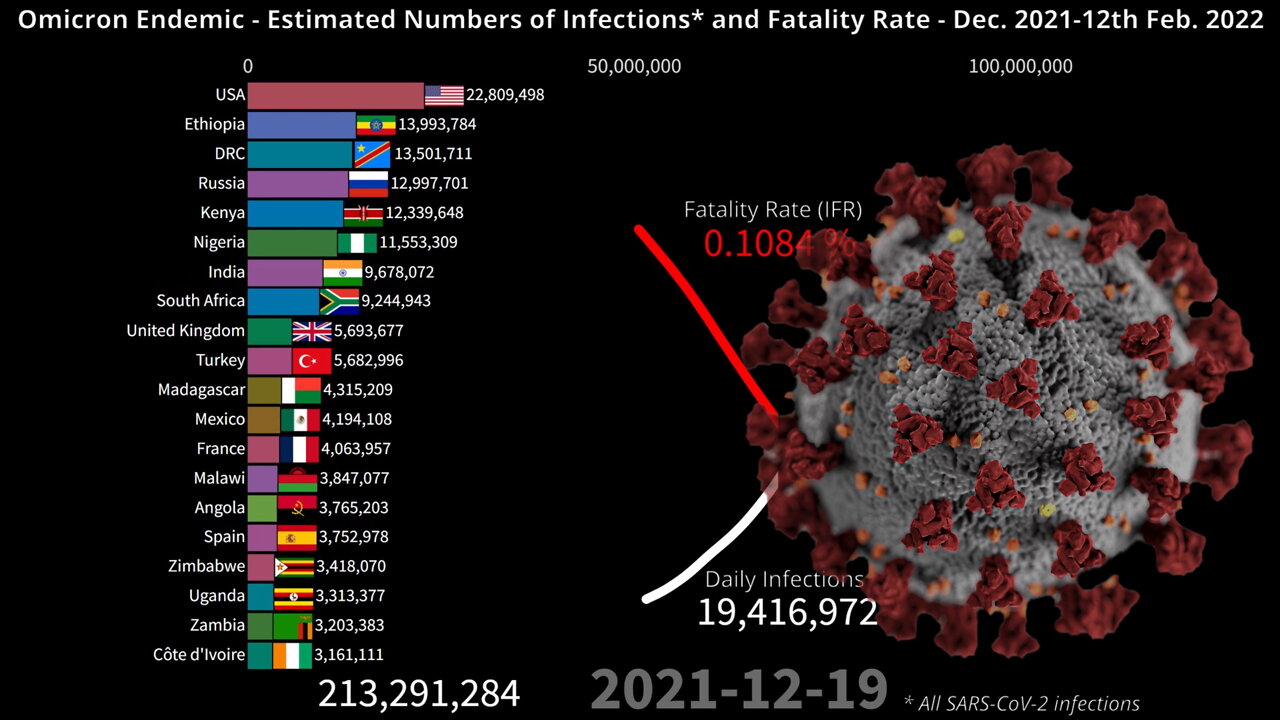
This bar chart race shows the estimated accumulated number of SARS-CoV-2 infections by country, world daily number of infections and infection fatality rate (IFR), during the omicron surge from 1st December 2021 to 12th February.
All SARS-CoV-2 variants are included in the numbers to illustrate how the number of infections and fatality rate changes over the time period when omicron become the dominant variant.
Estimates of infections recent week are extrapolated projections.
Please note that;
Cases are not the same as infections. Cases are confirmed numbers, while infections are estimated numbers. Case Fatality Rate (CFR) is calculated as deaths in percentage of confirmed cases, while Infection Fatality Rate (IFR) is calculated as deaths in percentage of estimated cases.
A person infected with previous variants (like Delta) could be reinfected with omicron. Number of infections are not the same persons who have been infected.
Sources:
Institute for Health Metrics and Evaluation (IHME), European Centre for Disease Prevention and Control (ECDC) and John Hopkins University (CSSE)
Music:
Omega by Scott Buckley – www.scottbuckley.com.au
Special background effect by:
AA VFX: https://www.youtube.com/c/dvdangor2011/
-
 55:11
55:11
Flyover Conservatives
1 day agoParents WIN, Teachers Unions PANIC! 3 Huge Education Bombshells This Week! - Corey DeAngelis | FOC Show
34.6K -
 1:40:20
Glenn Greenwald
8 hours agoTulsi's Hearing Exposes Bipartisan Rot of DC Swamp | SYSTEM UPDATE #400
95.4K190 -
 1:19:48
Simply Bitcoin
13 hours ago $8.03 earnedJerome Powells MASSIVE Bitcoin Backflip! | EP 1172
70.9K5 -
 58:42
58:42
The StoneZONE with Roger Stone
5 hours agoLBJ + CIA + Mob + Texas Oil = JFK Murder | The StoneZONE w/ Roger Stone
52.4K27 -
 58:00
58:00
Donald Trump Jr.
12 hours agoBreaking News on Deadly Plane Crash, Plus Hearing on the Hill, Live with Rep Cory Mills & Sen Marsha Blackburn | TRIGGERED Ep.212
184K139 -
 52:03
52:03
Kimberly Guilfoyle
11 hours agoLatest Updates on Deadly Air Collision, Plus Major Hearings on Capitol Hill,Live with Marc Beckman & Steve Friend | Ep.192
104K38 -
 1:17:16
Josh Pate's College Football Show
9 hours ago $1.59 earnedMichigan vs NCAA | ESPN’s ACC Deal | Season Grades: UGA & Miami | Notre Dame Losses
43.6K2 -
 1:26:50
Redacted News
9 hours agoWhat happened? Trump DESTROYS the Pete Buttigieg run FAA for tragic airline crash | Redacted News
230K190 -
 LIVE
LIVE
VOPUSARADIO
1 day agoPOLITI-SHOCK! Hero Angela Stanton King & Wrongfully Imprisoned J6 Prisoner Josh Pruitt!
81 watching -
 43:37
43:37
Candace Show Podcast
9 hours agoThe Taylor Swift Plot Thickens | Candace Ep 142
149K131