Premium Only Content

RSI Trading Strategy | RSI Divergence Explained | RSI Candlestick Chart Technical Analysis
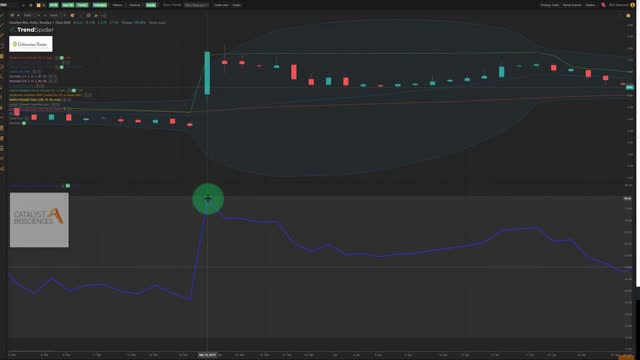
New Relative Strength Indicator Strategy Lessons for 2022. Tutorial for RSI Divergence for beginners. Advanced Contrarian Trading tutorials for RSI Day traders and Swing Traders.
Here’s what you’ll learn:
* What is the RSI and how you can harness the power of identifying RSI divergences.
*For beginners you will learn the basics of the RSI and how Getting Started In Technical Analysis, Technical Analysis for Dummies are out of date. We will replace myths and replace them with new tactics for the 21st Century
* How can the Relative Strength Indicator or Relative Strength Index help you spot "Extreme| and "Unsustainable" overbought and oversold swing trade and day trade opportunities.
*Learn how to use RSI as a leading indicator in conjunction with other leading indicators such as the Bollinger Bands, price, volume and lagging indicators such as MACD and the moving averages.
*Learn the power of the Bollinger Band Strategy in conjunction with the RSI.
*Learn how TrendSpider can be modified to allow for a customized RSI giving you an edge over other traders.
*Learn how to calculate RSI to ensure the best risk-reward entry points for each stock, commodity, forex or crypto trade you make using the Relative Strength Indicator as a part of your overall investment strategy.
*RSI basics for those who want to learn how to trade or great for stock market for beginners
-
If you are interested in automating your trading routine/system, we recommend this Software Which Identifies Historical Seasonal Trends And Market Cycles.
This is Software that we trust.
GET IT HERE ▶▶▶ https://bit.ly/31MqVJG ◀◀◀
-
 LIVE
LIVE
Wahzdee
1 hour agoSniper Elite Then Extraction Games—No Rage Challenge! 🎮🔥 - Tuesday Solos
473 watching -
 LIVE
LIVE
Robert Gouveia
1 hour agoSenator's Wife EXPOSED! Special Counsel ATTACKS; AP News BLOWN OUT
2,192 watching -
 LIVE
LIVE
Barry Cunningham
7 hours agoTRUMP DAILY BRIEFING - WATCH WHITE HOUSE PRESS CONFERENCE LIVE! EXECUTIVE ORDERS AND MORE!
2,921 watching -
 LIVE
LIVE
Game On!
2 hours agoPUMP THE BRAKES! Checking Today's Sports Betting Lines!
150 watching -
 1:27:21
Redacted News
1 hour agoBREAKING! SOMETHING BIG IS HAPPENING AT THE CIA AND FBI RIGHT NOW, AS KASH PATEL CLEANS HOUSE
30.2K52 -
 1:08:28
In The Litter Box w/ Jewels & Catturd
21 hours agoCrenshaw Threatens Tucker | In the Litter Box w/ Jewels & Catturd – Ep. 749 – 2/25/2025
34.3K22 -
 44:57
44:57
Standpoint with Gabe Groisman
22 hours agoWill Byron Donalds Run for Florida Governor? With Congressman Byron Donalds
3.95K2 -
 LIVE
LIVE
Savanah Hernandez
1 hour agoEXPOSED: FBI destroys evidence as NSA’s LGBTQ sex chats get leaked?!
945 watching -
 LIVE
LIVE
Revenge of the Cis
3 hours agoEpisode 1452: Hindsight
1,549 watching -
 1:20:35
Awaken With JP
4 hours agoCrenshaw Threatens to Kill Tucker and Other Wild Happenings - LIES Ep 80
50K29