Premium Only Content

Compare Bluechip timeframe trading results.
Compare Bluechip timeframe trading results.
Welcome to Pete’s investing updates
in this strategy edition we will be talking about .... (Alligator Bluechip Daily Trading vs 15 minute timeframes)
Don't forget...
First always remember to review petesinvesting channel playlists
Updated every weekend I look at the charts of some select blue chip shares as well as some key world sharemarket indices.
As always click on the SUBSCRIBE button as well as the NOTIFICATION bell and LIKE this video to support this channel.
If you want me to review an Index a share, a commodity or a FOREX pair, put it in the comments and I'll cover it in a future video
Things
to consider:
•We track and trade on a Daily chart since we want to back test and see results of trades back during the GFC as well as Covid effects.
•We track and back test Revenue over Drawdown requirements
(as a %) to optimize our returns with less exposure. We do not use stop losses. If you want to use stop losses I suggest you only use minimal funds to trade or gamble on any speculative instruments. I've made videos highlighting pros and cons of stop losses and what I think of speculative stocks. See Links below for those videos.
•Brokerage is included in our back testing. I use $8 per transaction each time we buy or sell. Revenue shown may change slightly depending on your brokerage costs.
•Our Back testing transacts with $2,000 per trade. ie everytime you purchase $2k worth of shares in the instrument you want to invest.
To increase Revenue (ie returns) simply increase this. But beware this will also increase your Drawdown, so ensure you factor in this with your money management strategy.
Dividends are not included in our back testing. So any dividends received is a bonus on top of our realised gains.
Lets get started
Remember...
Don't forget to subscribe / LIKE and hit the notification bell and review the PETESINVESTING channel playlists for further reference.
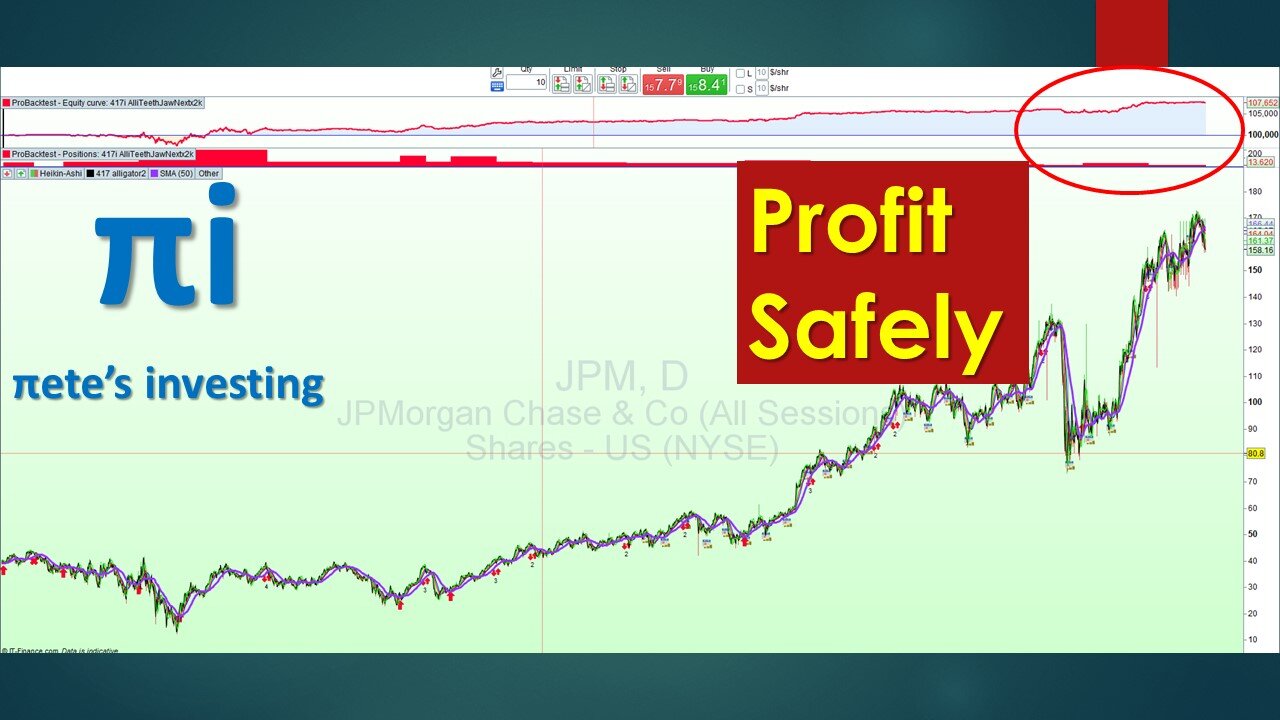
Using a Daily price chart, we review the weekly progress of a sample of Bluechip stocks from Australia, the US and Europe - Telefonica (TEF.BME), Commonwealth Bank Of Australia (CBA.AX), BHP Group Ltd Australia (BHP.AX), JPMorgan and Chase (JPM.NYSE), Volkswagen AG (VOW.XETRA), Johnson & Johnson (JNJ.NYSE), Caterpillar Inc (CAT.NYSE).
Showing any new open and closed positions, profitability and draw down requirements dependent on the trend of the respective price charts.
Supporting videos:
Alligator strategy explained:
https://youtu.be/1SMSRQV7GZE
Whats wrong with Stop Losses
https://youtu.be/FwrjwGs_ito
Rumble updates
https://rumble.com/register/peteeight/
Bitchute updates:
https://www.bitchute.com/channel/pTjWs2A7K9Br/
Become a PetesInvesting Patreon member with same day updates on
https://www.patreon.com/petesinvesting
Money Management:
https://youtu.be/nvvcldeeZS4
Average Down Do's and Don'ts
https://youtu.be/SZbh2Me4kq0
Simple Trading Strategy with CCI and Avg Down technique
https://youtu.be/w35_YtV4YQU
Simple trading strategy https://youtu.be/ibVzRwCX-3Q
Average Down Strategy https://youtu.be/RFCb5S78D8o
#bluechiptrading #sharetrading
-
 2:22
2:22
Petes Investing
7 days agoBITCOIN reaches NEW HIGHS BUT WATCH Bearish Divergence
361 -
 LIVE
LIVE
SynthTrax & DJ Cheezus Livestreams
9 hours agoDJ Cheezus & DEF JAM Fight for NY on PS2 - Hip Hop Violence and Vibes (1pm PST / 4pm EST)
951 watching -
 2:01:47
Nerdrotic
4 hours ago $6.58 earnedEgypt, Peru and Guatemala Luke Caverns RETURNS! | Forbidden Frontier #082
26K4 -
 LIVE
LIVE
Vigilant News Network
4 hours agoFDA Approves Trials for New “Pandemic” Vaccine | Media Blackout
2,377 watching -
 4:06:21
GamerGril
5 hours agoIM THE GREASTEST OF ALL TIME AT.... CHAOS | DAYS GONE
59.6K5 -
 3:00:18
Due Dissidence
1 day agoTHE PEOPLE VS NATURE by Kevin Augustine - plus a talkback w/ Jimmy Dore
71.3K8 -
 6:02:06
Rotella Games
10 hours agoMake the Hood Great Again | Day 3 | GTA San Andreas
46.2K5 -
 2:50:48
PudgeTV
10 hours ago🟡 Practical Pudge Ep 48 with "Willie Faulk" | Catching Up With Old Friends
42K2 -
 18:32
18:32
Forrest Galante
23 hours ago5 Extinct Animals That I Believe Could Still Be Alive...
150K36 -
 DVR
DVR
Major League Fishing
3 days agoLIVE! - General Tire Team Series: Summit Cup - Day 1
143K7