
Stock Forecasting Indicator Trend Probability Map
3 years ago
761
Stock Forecasting Indicator Trend Probability Map
https://tradingrobot.trade/altredo-stock-forecasting-indicator-tradestation.aspx
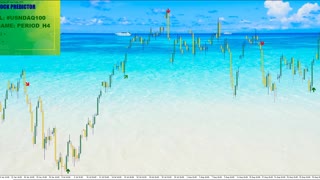
STOCK FORECASTING INDICATOR TREND PROBABILITY MAP
▶️ The Stock Predictions & Stock Forecasting Probability Map indicator is designed to predict future price movements and trends in stocks, futures and currencies. Powered by TradeStation platform. The indicator forecasting algorithm is based on linear regression. The indicator is remarkable in that, in addition to predicting the trend of stocks, it also visually shows the boundaries of the forecast error in the form of a Probability Map. The indicator is designed for use on 1 Day timeframes, it can also be used on weekly and monthly timeframes: 1 Week, 1 Month.
Loading comments...
-
 25:54
25:54
Trading Robot - Global Trading Systems!
2 years agoTD Ameritrade Automated Options Trading Robot
9971 -
 3:09
3:09
Trading Robot - Global Trading Systems!
3 years ago $0.02 earnedOnline Stock Predictor Predicts NASDAQ Index Trend Reversal | Trading NASDAQ
822 -
 4:31
4:31
ChartAction
4 years agoFord Stock Technical Analysis testing hourly trend line
67 -
 21:34
21:34
kpmooney
4 years agoLognormal Distributions: Calculating the Probability of a Stock Range with Excel and Python
37 -
 4:02
4:02
Ndingani
3 years agoForexSpectrum indicator review
20 -
 4:02
4:02
Ndingani
3 years agoForexSpectrum Indicator honest review
231 -
 3:02
3:02
Aruzo
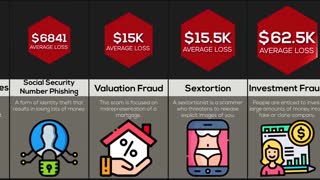
3 years agoProbability Comparison Scams
28 -
 3:02
3:02
Aruzo
3 years agoProbability Comparison Scams
22 -
 3:02
3:02
Aruzo
3 years agoProbability Comparison Scams
15 -
 3:02
3:02
Aruzo
3 years agoProbability Comparison Scams
13