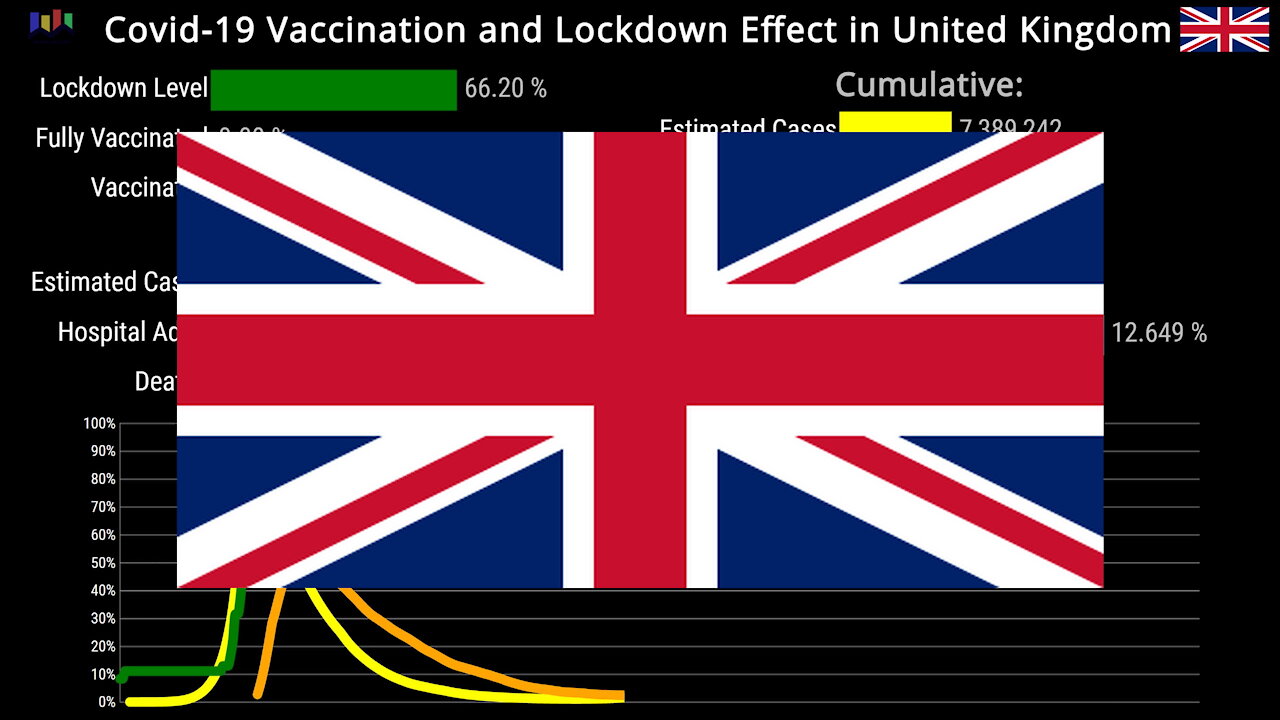
Covid-19 Vaccination and Lockdown Effects in United Kingdom 🇬🇧
These bar charts and graphs show effects of lockdown levels and vaccinations in United Kingdom from January 31 2020 until April 15 2021. The combination of lockdowns and vaccination rollout started in mid-December 2020.
The effects are shown as daily estimated cases and hospital admissions. The reference is the peak days (100 %). Lockdown levels (government response) and vaccinations are shown as the real percentage and share of population.
Fatality rates: Case Fatality Rate (CFR), is the number of deaths in percentage of confirmed cases. Infection Fatality Rate (IFR) is the number of death in percentage of estimated cases.
The number of hospital admissions starts at 27th March 2020. There were admissions before this date, but the numbers are not published before this date.
Sources:
Epidemiological models for estimated cases: Imperial College London (ICL), Institute for Health Metrics and Evaluation (IHME)
UK hospital admissions, confirmed cases and deaths data: Public Health England (PHE)
Government Stringency Index: Thomas Hale, Sam Webster, Anna Petherick, Toby Phillips, Beatriz Kira Oxford COVID-19 Government Response Tracker, Blavatnik School of Government.
Original music by Savfk
https://www.youtube.com/savfkmusic
https://www.facebook.com/savfkmusic
Savfk - All the King's Horses is under a Creative Commons Attribution 4.0 International License (CC BY 4.0)
https://creativecommons.org/licenses/by/4.0/
-
 0:26
0:26
Just the News
4 years agoUnited Kingdom becomes first Western nation to approve COVID-19 vaccine
32.4K19 -
 2:49
2:49
WMAR
3 years agoNext steps after COVID-19 vaccination
3484 -
 2:14
2:14
WMAR
3 years agoWarning about COVID-19 vaccination scam
1.23K -
 27:00
27:00
Squaring The Circle, A Randall Carlson Podcast
6 hours agoSPECIAL EPISODE: #037 Randall Carlson Explains The Vital Role of Sacred Geometry in the Modern Age.
6931 -
 15:31
15:31
DEADBUGsays
2 hours agoThe Sagamihara Massacre (Japans worst modern day mass killing)
821 -
 1:24:06
TheDozenPodcast
20 hours agoIslamist Gangsters, Grooming Gangs, Labour Elites: Raja Miah
5.8K4 -
 19:39
19:39
Fit'n Fire
22 hours ago $2.13 earnedRiley Defense RAK47 "Krink" 1,696 Rounds Later
23.2K5 -
 31:05
31:05
The Finance Hub
18 hours ago $5.32 earnedI CAN'T BELIEVE WHAT JUST HAPPENED TO BARACK OBAMA!
14.1K23 -
 5:00
5:00
Adam Does Movies
15 hours ago $0.79 earnedCompanion Movie Review - Objectifying Sexbots Ends Today!
8.69K1 -
 14:23
14:23
GBGunsRumble
1 day agoGBGuns Armory Ep 136 Genesis Arms Gen-12 SSBM
6.33K2