Premium Only Content

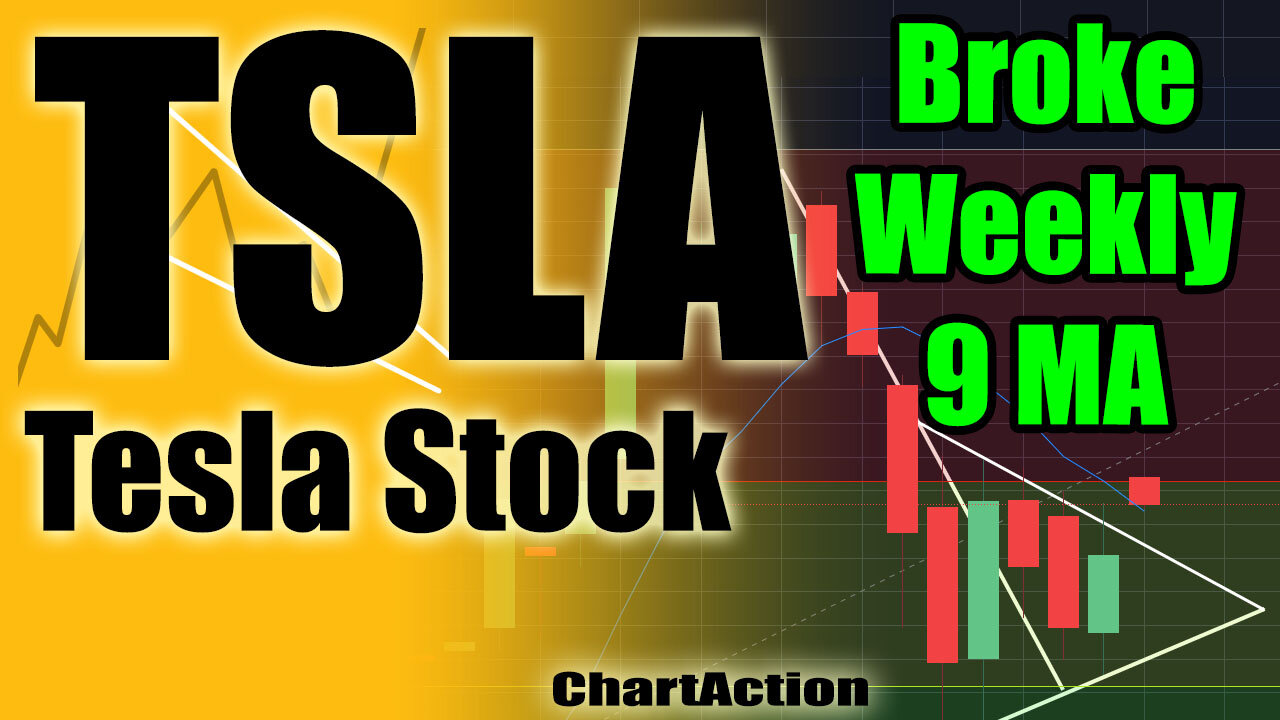
Tesla TSLA Stock FINALLY Broke Weekly 9 Moving Average
How to View Charts - https://www.youtube.com/watch?v=7TnJiyTdujo
I show you how TSLA Tesla Stock broke out of the triangle pattern I was looking at and how at the same time it was breaking the weekly 9 moving average. To me it looks like we are reversing but I also show you how the 4 hour 180 moving average is giving us resistance.
Thank you for watching my opinion. -CHARTACRTION
Subscribe and hit the bell for notifications so you can stay up to date when a video comes out.
Affiliate links:
Get on the waiting list for the BlockFi Credit card and earn BTC rewards - https://blockfi.com/credit-card-waitlist/?r=F3qsL
BlockFi Sign Up and Deposit $100 and Get $10 - https://blockfi.com/?ref=239a71d0
M1 Finance Signup/Fund50$ $10 Bonus - https://m1.finance/syWHLi69_2cp
Coinbase Signup - https://www.coinbase.com/join/salaza_i
CoinBaseEarn EOS Videos $10 - https://coinbase.com/earn/eos/invite/bg0v4d1h
CoinbaseEarn XLM Videos $10 - https://coinbase.com/earn/xlm/invite/nftv4wbd
Disclaimer: Not financial advice. Please be careful when trading this channel is just my opinion of what the charts look like and what I see. This is to be used ALONGside your technical analysis and to give you things think about that you might have missed. You have to make your own decisions so be careful this is risky business.
If I talk about a stock I am either invested in it, I trade it, or I am interested in trading or investing in it. It's possible I am bullish or bearish at the time of publishing but my sentiment can change over time.
-
 3:48
3:48
ChartAction
5 months agoDogecoin Testing Support On Rising Wedge
151 -
 2:51
2:51
ChartAction
3 years ago $0.05 earnedPLTR Stock Analysis Watching the Daily 9 Moving Average
148 -
 2:41
2:41
ChartAction
3 years agoTesla TSLA Stock Holding Support For Now
60 -
 2:48
2:48
ChartAction
3 years agoTesla TSLA Stock Correction Levels to watch
75 -
 4:14
4:14
ChartAction
3 years ago $0.01 earnedTesla Stock Long Term Price Today Riding Weekly 9 MA Technical Analysis
28 -
 2:16
2:16
ChartAction
3 years agoTesla TSLA technical analysis - broke up but got resistance
19 -
 2:36
2:36
ChartAction
3 years agoFinally broke above 9 MA Bitcoin Price Technical Analysis
68 -
 8:32
8:32
Millionaire Money Club
3 years agoHow To Generate Weekly Income In The Stock Market!
82 -
 LIVE
LIVE
TheMonicaCrowleyPodcast
1 hour agoThe Monica Crowley Podcast: Mandate into Action
402 watching -
 1:02:09
TheAlecLaceShow
4 hours agoGuests: Alex Marlow & Terry Schilling | Justice For Laken Riley | Russian ICBM | The Alec Lace Show
21.7K7