Premium Only Content
This video is only available to Rumble Premium subscribers. Subscribe to
enjoy exclusive content and ad-free viewing.

The (not so) humble (interactive) histogram
3 years ago
38
histograms
interactive data visualization
exploratory data analysis
statistical analysis
rstat
loonr
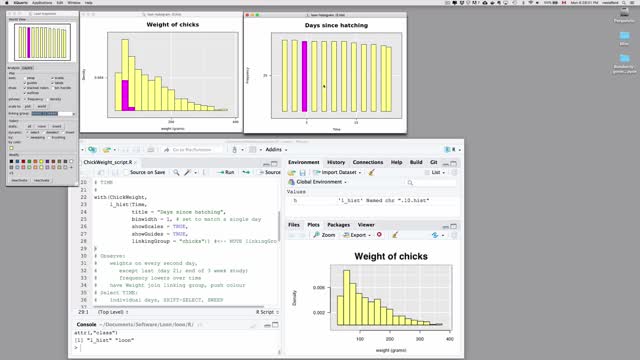
Introduces the interactive histograms in the data visualization environment called loon. Demonstrates its use in two different applications:
1. An experimental study on the weights of chicks given different diets
- the ChickWeight data in R
2. An observational study on coronary risk factors in 1979 rural South Africa
- the SAheart data from the R package ElemStatLearn (now available in loon.data)
Loon is open source TCL/Tk and is available as an R package.
Loading comments...
-
 42:54
42:54
KHS375
3 years agoHumble Yourself Before God
53 -
 0:17
0:17
ffoxwjf
3 years agoReal humble talk
37 -
 1:15
1:15
CountingTheDays
3 years agoDo You Have a Humble Heart?
61 -
 3:52
3:52
Creative Guise Productions
3 years agoMo Lowda and the Humble. 6-7.
28 -
 1:44
1:44
WXYZ
4 years agoTigers top picks humble as expectations soar
15 -
![You're very humble, always be like that [Quotes and Poems]](https://1a-1791.com/video/s8/1/7/n/W/k/7nWkb.0kob-small-Youre-very-humble-always-be.jpg) 0:30
0:30
Frases e Poemas - Quotes and Poems
3 years agoYou're very humble, always be like that [Quotes and Poems]
6 -
 1:00
1:00
ScofflawFarm
3 years agoScofflaw Nightlife presents: the Humble Opossum: a three-part mini-series (part 2)
117 -
 1:02
1:02
ScofflawFarm
3 years agoScofflaw Nightlife presents: the Humble Opossum: a three-part mini-series (part 3)
74 -
 0:43
0:43
ScofflawFarm
3 years agoScofflaw Nightlife presents: the Humble Opossum: a three-part mini-series (part 1)
1281 -
 5:25
5:25
Creative Guise Productions
3 years agoMo Lowda & the Humble. The Way home LIve at Indy Skyline Sessions.
15