Create a control chart using Python 📊
#Python #ControlChart #StatisticalProcessControl
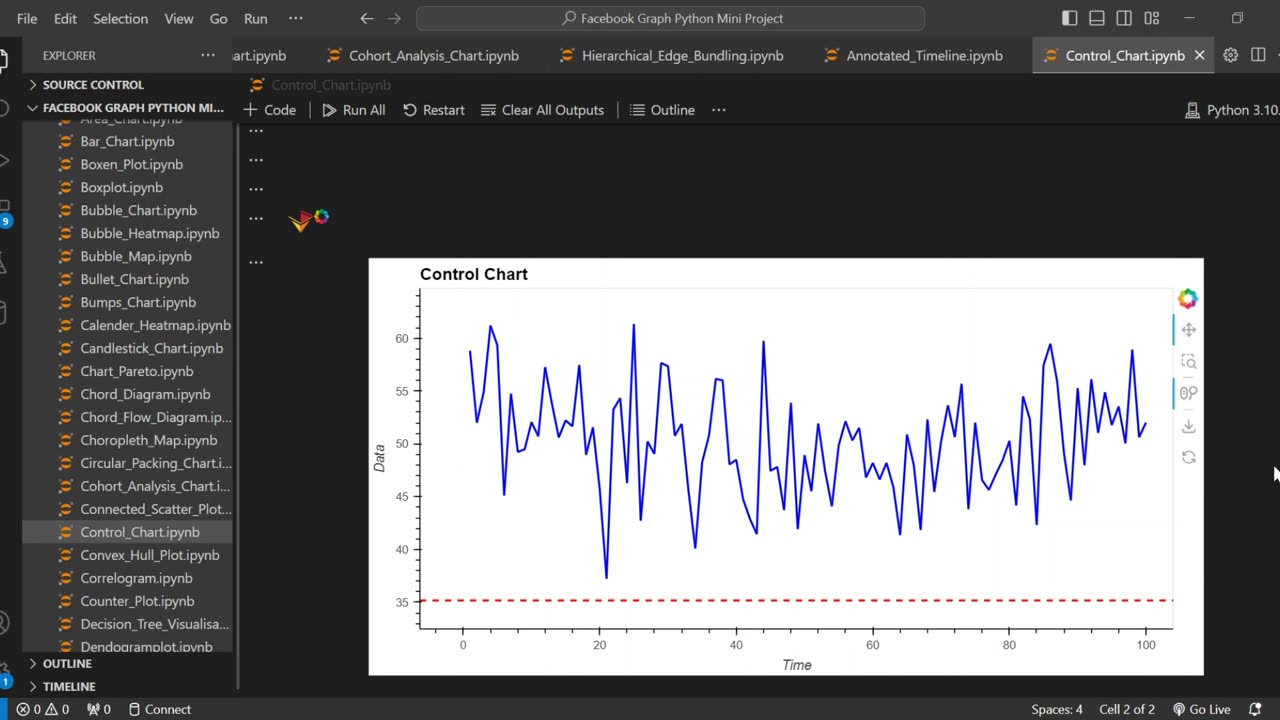
In this tutorial, I’ll show you how to create a Control Chart (also known as a Statistical Process Control (SPC) Chart) using Python. Control charts are essential for monitoring process stability and detecting variations in manufacturing, healthcare, finance, and more.
🔹 What You’ll Learn:
✔ How to generate synthetic process data using NumPy
✔ Calculating Upper Control Limit (UCL) and Lower Control Limit (LCL)
✔ Visualizing control charts with HoloViews and Bokeh for interactive plots
✔ Customizing the chart for better readability
👍 If you found this helpful, don’t forget to LIKE, SUBSCRIBE, and hit the NOTIFICATION BELL!
#Python #ControlChart #StatisticalProcessControl #HoloViews #DataVisualization
#SPC #QualityControl #PythonTutorial #DataScience #NumPy #Pandas
#Bokeh #SixSigma #LeanManufacturing #ProcessImprovement #Coding
-
 57:01
57:01
Man in America
14 hours ago🚨 RED ALERT: Miscarriages & Infertility Are SKYROCKETING—OBGYN Warns of Population Collapse
50.7K84 -
 23:33
23:33
Friday Beers
11 hours ago $20.18 earnedTensions Explode During Wild West Mafia Game!
91.6K10 -
 1:22:39
Badlands Media
1 day agoAltered State S.3, Ep. 26
81.7K19 -
 5:42:28
JdaDelete
13 hours ago $10.82 earnedBanjo-Kazooie - wedNESday
75.8K6 -
 30:09
30:09
Iggy Azalea
15 hours ago $7.82 earnedplaying motherland
83.9K45 -
 8:00:03
SpartakusLIVE
12 hours agoDuos w/ Rallied || A Spartan and a Dragon ENTERTAIN the MASSES
78.6K5 -
 20:09
20:09
Exploring With Nug
20 hours ago $3.13 earnedVanished After Driving Away… I Spent the Day Searching Lakes
76.2K13 -
 1:14:13
Glenn Greenwald
12 hours agoLee Fang and Leighton Woodhouse Look Back on Trump’s First 100 Days; Lara Friedman on New Laws Barring Israel Criticism | SYSTEM UPDATE #446
146K67 -
 9:01:19
ZWOGs
18 hours ago🔴LIVE IN 1440p! - DEATH STRANDING 1 - PLAYTHROUGH | DAY 4 | - Come Hang Out!
47.3K10 -
 1:45:28
Joker Effect
9 hours agoWhy aren't you trying to enjoy yourself? Live a little! go.mother.land/Joker
36.7K5