Premium Only Content
This video is only available to Rumble Premium subscribers. Subscribe to
enjoy exclusive content and ad-free viewing.

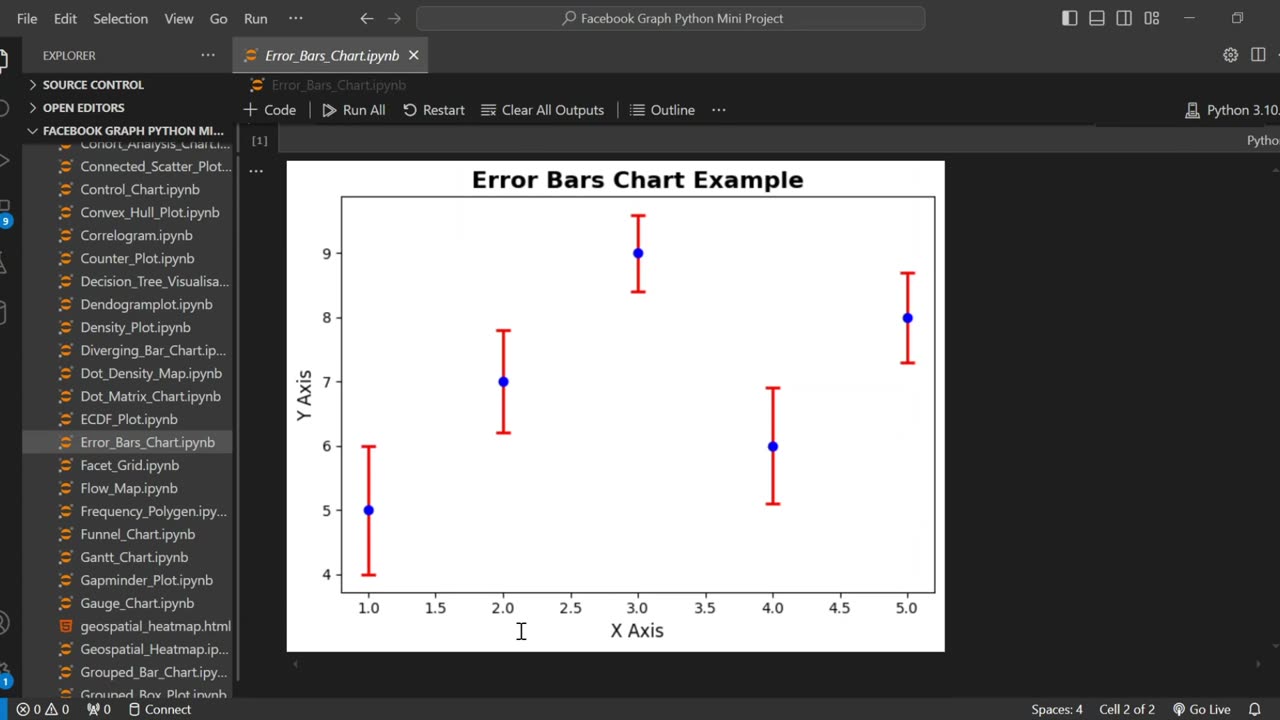
Create Error Bar Charts in Python 📊
8 hours ago
6
Learn how to create professional error bar charts in Python using Matplotlib! This step-by-step tutorial is perfect for beginners in data visualization, scientific plotting, or data analysis. I’ll walk you through the entire process—from setting up your data to customizing error bars with colors, caps, and styles.
👍 Enjoyed the video? Like, Subscribe & Hit the Bell Icon for more Python tutorials!
#Python #Matplotlib #DataVisualization #ErrorBars #DataScience #PythonTutorial #CodingForBeginners #ScientificPlotting #PythonPlotting #LearnPython #Statistics #DataAnalysis #Programming #TechTutoria
Loading 1 comment...
-
 LIVE
LIVE
The Quartering
2 hours agoBombshell Karmelo Anthony Update, Star Wars New Low, Gays Buying Babies Nintendo Switch Drama & More
19,780 watching -
 1:11:52
Russell Brand
1 hour agoThey LIED About 9/11—Now the Truth Is Leaking Out – SF572
43.8K39 -

Sean Unpaved
2 hours agoNFL Draft Deep Dive: First-Round Movers & Stars to Watch
4.6K -
 LIVE
LIVE
Akademiks
1 hour agoDay 9/30. Shannon Sharpe Own Homies Turning They back on him? Uzi Rushed to Hospital? Lil Durk Bond
2,436 watching -
 54:38
54:38
Ben Shapiro
2 hours agoEp. 2185 - My Journey To Ukraine and My Interview With Zelensky
8.1K15 -
 1:59:11
The Dilley Show
2 hours ago $7.30 earnedTrump Oval Office, 100 Days Rally and More! w/Author Brenden Dilley 04/24/2025
8.34K -
 LIVE
LIVE
SternAmerican
23 hours agoElection Integrity Call - Expose the Fraud. Defend the Republic. Thursday, April 24th | 2:00 PM EST
149 watching -
 LIVE
LIVE
The Boomer Effect
17 hours agoIt's Your Money! Not Washington's
71 watching -
 1:01:59
Timcast
2 hours agoKyiv ATTACKED, Trump Tells Putin “STOP,” Slams Zelenskyy For REFUSING Peace Ft Sebastian Gorka
95.6K70 -
 LIVE
LIVE
Viss
4 hours ago🔴LIVE - DARK BROTHERHOOD Questline Today! - TES IV Oblivion Remastered
336 watching