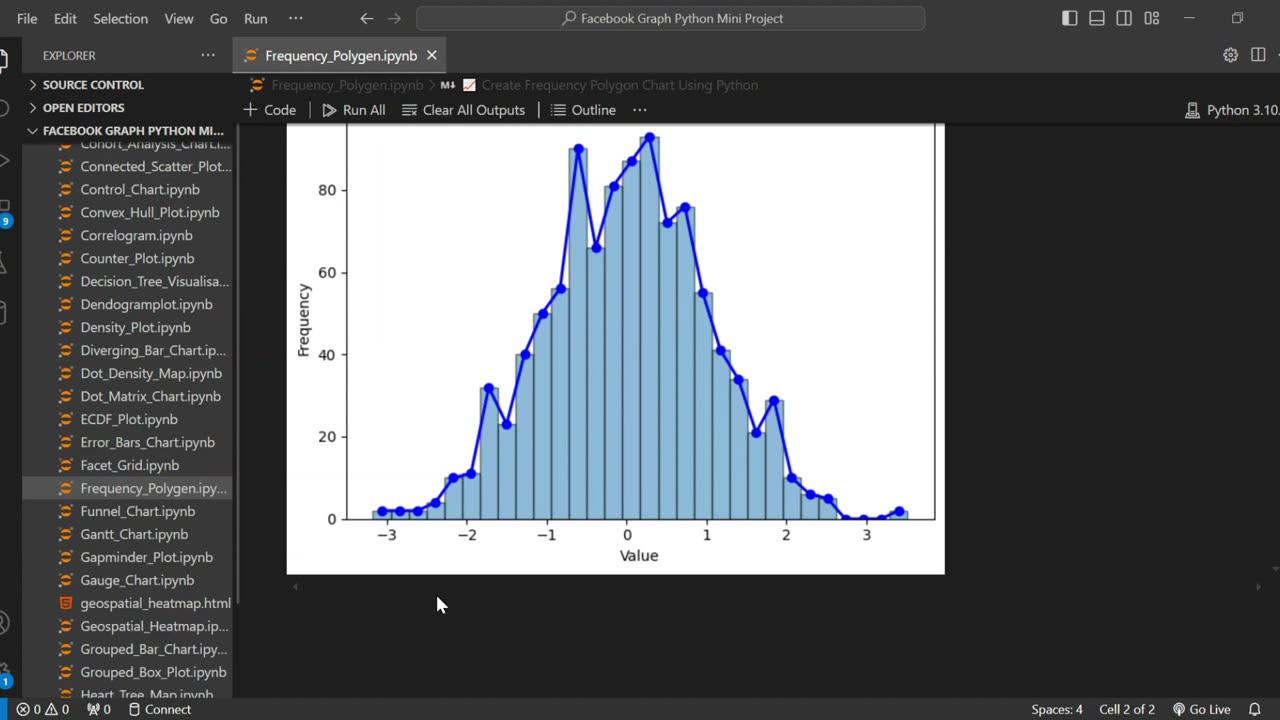
Create a Frequency Polygon Using Python
Learn how to visualize data distributions effectively by creating a frequency polygon in Python using Matplotlib. This tutorial provides a clear, step-by-step guide to help you understand and implement frequency polygons for your data analysis projects.
📌 What You'll Learn:
✔️ What a frequency polygon is and when to use it
✔️ How to prepare and structure your data
✔️ Step-by-step code walkthrough using Matplotlib and NumPy
✔️ Customizing your plot (colors, markers, labels, and styles)
👍 Like, Subscribe & Comment if you found this helpful!
#Python #Matplotlib #DataVisualization #Statistics #DataScience #Programming #DataAnalysis #Tutorial #LearnPython #NumPy #PythonProgramming #DataViz #MachineLearning #AI #PythonTutorial #Coding #Stem #DataAnalytics #PythonForBeginners #DataScientists #TechTutorial #ProgrammingLife #CodeNewbie #PythonCode #OpenSource #Visualization #Math #Probability #DataEngineering #LearnToCode
-
 2:05:48
Steven Crowder
4 hours ago🔴 Jordan Peterson, Joe Rogan, & The 'Woke Right': What is the Truth Behind it All?
212K216 -
 LIVE
LIVE
The Tom Renz Show
1 hour agoThe Left’s Lies About Compassion & Faith
124 watching -
 LIVE
LIVE
Rebel News
48 minutes agoPoll skepticism, Brantford boomer drama, Peterson talks Rebel with Rogan | Rebel Roundup
568 watching -
 DVR
DVR
Neil McCoy-Ward
50 minutes ago⚠️ “Life Will Come To A Standstill” As 🇬🇧 British Economy About To PLUMMET!!!
5.08K3 -
 12:16
12:16
Cowboy Kent Rollins
6 days ago $0.04 earnedFried Onion Burger | Famous Oklahoma Fried Onion Burger Recipe
1694 -
 LIVE
LIVE
The Dilley Show
1 hour agoRFK Results, Trade War Cools and More! w/Author Brenden Dilley 04/23/2025
2,495 watching -
 1:14:43
The Rubin Report
3 hours agoJordan Peterson Makes Joe Rogan Go Quiet with This Chilling Warning for the ‘Right’
45.6K59 -
 DVR
DVR
Benny Johnson
2 hours ago🚨 Elon Musk Makes SHOCK Announcement About Future in Trump Admin | Klaus Schwab Under INVESTIGATION
62.3K74 -
 LIVE
LIVE
The Shannon Joy Show
4 hours ago🔥🔥Corruption At HHS Under RFK Jr? Explosive New Substack From Dr. Mary Talley Bowden Exposing How #MAHA Frontman Calley Means Plans To CASH IN On Leverage At HHS. With Special Guest - Major Tom Haviland!🔥🔥
379 watching -
 1:05:17
Blockchain Basement
2 hours ago$94,000 Bitcoin MEGA PUMP! (Klaus Schwab To PRISON!)
1.23K2