How to Create a Sales Funnel Chart in Python 🐍 with Plotly Express 📊
5 hours ago
2
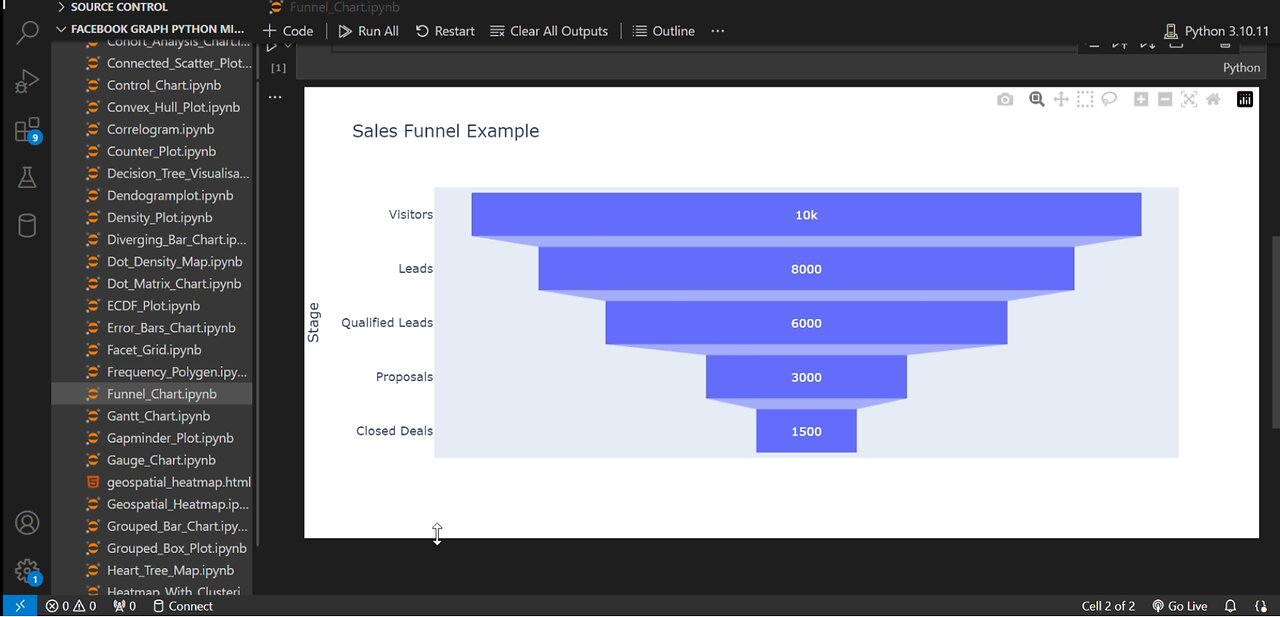
📊 Learn how to create a professional Sales Funnel Chart in Python using Plotly Express! In this step-by-step tutorial, I'll show you how to visualize your sales or marketing pipeline with an interactive funnel chart. Perfect for tracking conversions, analyzing drop-offs, and presenting data insights clearly.
🔹 What You'll Learn:
✅ How to set up your data in Pandas
✅ Creating a funnel chart with Plotly Express
✅ Customizing colors, labels, and layout
✅ Exporting your chart for reports/presentations
#Python #DataVisualization #Plotly #FunnelChart #SalesFunnel #DataScience #PythonTutorial #Pandas #MarketingAnalytics #BusinessIntelligence #DataAnalysis #PythonProgramming #Coding #DataAnalytics #TechTutorial
Loading comments...
-
 LIVE
LIVE
Steven Crowder
1 hour ago🔴 Race Conflict: Karmelo Anthony and the Truth About Black & White Relations in America
70,075 watching -
 LIVE
LIVE
The Rubin Report
42 minutes agoElizabeth Warren Humiliated as Her Lying to Host Backfires Spectacularly
2,312 watching -
 LIVE
LIVE
Benny Johnson
42 minutes agoDefense Sec Pete Hegseth Hands DOJ Evidence Of Leakers SABOTAGING Trump | Charges Incoming?!
6,038 watching -
 LIVE
LIVE
LFA TV
14 hours agoALL DAY LIVE STREAM - 4/22/25
3,778 watching -
 54:56
54:56
VINCE
2 hours agoSomething Suspicious Is Happening At The Pentagon | Episode 27 - 04/22/25
77.9K57 -
 LIVE
LIVE
Bannons War Room
2 months agoWarRoom Live
19,264 watching -
 LIVE
LIVE
Discover Crypto
1 hour ago🚀$100K BTC in MAY?! CRYPTO & GOLD SURGING NOW! (Get Ready)
240 watching -
 LIVE
LIVE
The Big Mig™
3 hours agoLet’s Talk Music Baste Records Artist & CEO Matthew Azrieli
4,713 watching -
 1:09:19
Dear America
14 hours agoTrump To Replace Hegseth? + Dems Hit ALL TIME LOW!
67.1K30 -
 2:13:13
Matt Kohrs
8 hours agoTurnaround Tuesday or Bust?! || The MK Show
28.3K4