Create a Choropleth Map with Python 🐍 & Plotly Express 🗺️✨
#Python #Pandas #Map
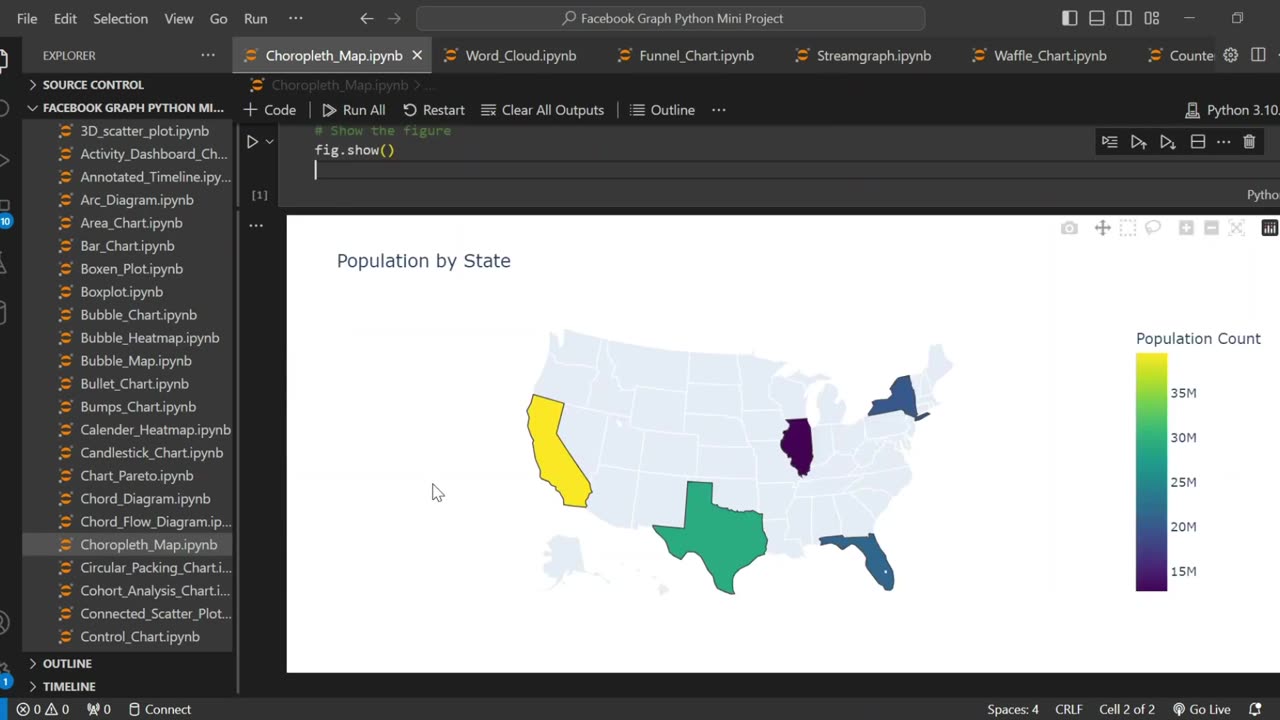
In this tutorial, I’ll show you how to create a professional choropleth map using Python and Plotly Express. Whether you're visualizing population data, election results, or regional trends, this step-by-step guide will help you build an interactive and visually appealing map with just a few lines of code!
🔹 What You’ll Learn:
✅ How to prepare data for a choropleth map using Pandas
✅ Using Plotly Express to create an interactive state-level map
✅ Customizing colors, labels, and titles for better visualization
✅ Displaying population data (or any metric) with color gradients
🚀 Perfect for:
Data analysts & scientists
Python beginners learning visualization
Anyone interested in geospatial data
🔔 Subscribe for more Python & data science tutorials!
👍 Like & Comment if you found this helpful!
#Python #DataVisualization #ChoroplethMap #PlotlyExpress #DataScience #PythonTutorial #DataAnalysis #Geospatial #Coding #LearnPython #Pandas #DataViz #Map #TechTutorial
-
 29:25
29:25
Forrest Galante
7 hours agoPrivate Tour of Billionaire's Secret Animal Sanctuary in India
38.6K3 -
 2:37:29
vivafrei
19 hours agoEp. 260: SCOTUS Blocks Trump Deportation? Letitia James Criminal Referral! RFK Jr. & Autism & MORE!
139K177 -
 7:30:34
iCheapshot
11 hours ago $2.66 earnedSunday Funday! |Happy Easter! | Happy 420 #BlazeIt
27.6K1 -
 2:25:04
TheSaltyCracker
9 hours agoHappy Easter ReeEEEe Stream 04-20-25
158K432 -
 2:25:28
Tundra Tactical
9 hours ago $5.40 earned$3200 ZEV HEARTBREAKER Contest!!!
48.5K2 -
 9:09:39
Delnorin Games
12 hours ago🔴 Live - Call of Duty
24.7K -
 2:19:42
THOUGHTCAST With Jeff D.
7 hours ago $0.55 earnedHAPPY EASTER! Sunday Night Game Chat with Jeff D.
16.5K1 -
 2:42:30
IsaiahLCarter
10 hours ago $7.45 earnedApostate Radio #011: The Revealing of Julie Behling
51.6K4 -
 4:22:35
a12cat34dog
11 hours agoMY 2ND YEAR OF GAMING ON RUMBLE :: LIVE VIDEO PREMIER :: THE ULTIMATE MONTAGE {18+}
58.5K20 -
 15:00
15:00
Mrgunsngear
1 day ago $10.94 earnedDan Wesson DWX: 2011 & CZ-75's Baby
111K29