Create Beautiful Histogram Plot in Python 📊 | Data Visualization Tutorial 🎨🐍
#numpy #Python #Histogram
Welcome to this step-by-step tutorial on how to create a beautiful histogram plot using Python! 📊✨
In this video, you will learn how to build and customize histogram charts using Matplotlib and NumPy. Histograms are essential for understanding the distribution of data, and this guide makes it easy for both beginners and intermediate learners.
🔍 What you'll learn:
How to generate random data with NumPy
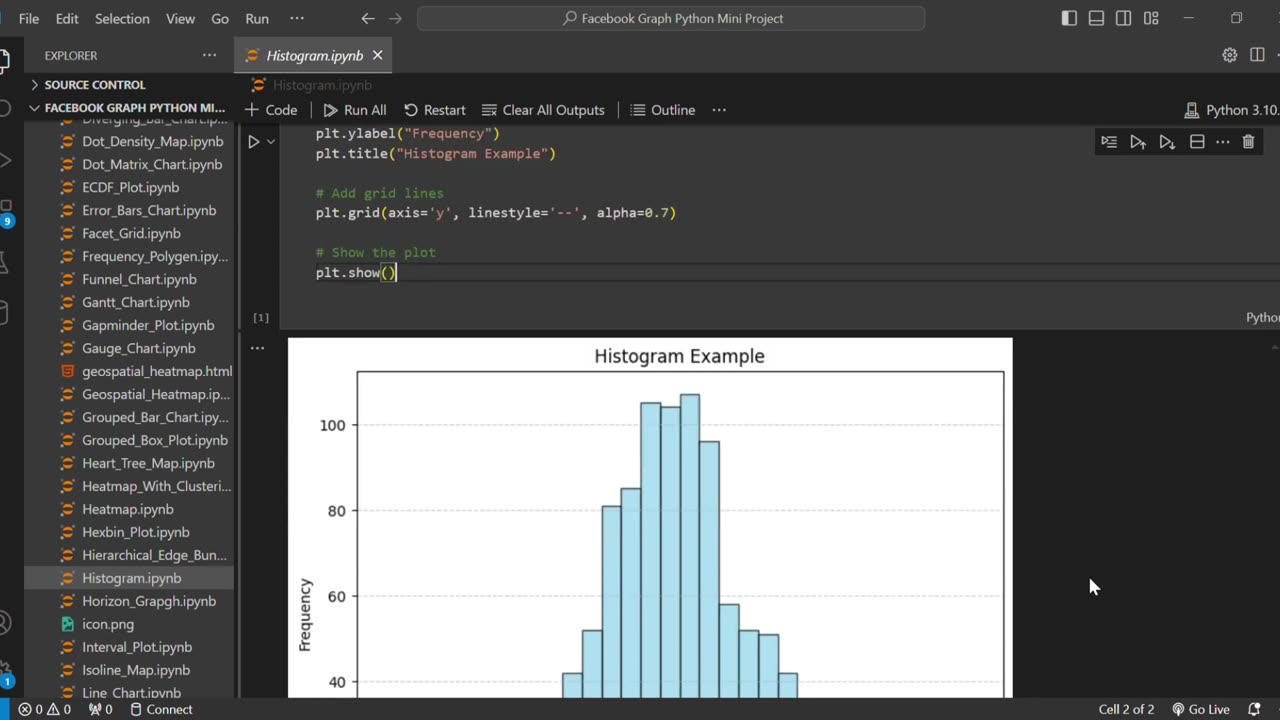
Creating histograms using Matplotlib
Customizing colors, labels, and grid lines
Making your plots visually appealing
Whether you're a data science student or a Python enthusiast, this tutorial will help you boost your data visualization skills. 🎓
📢 Don’t forget to LIKE, SHARE, and SUBSCRIBE for more tutorials on Python and Data Science!
#Python #Histogram #DataVisualization #Matplotlib #PythonTutorial
#python histogram plot #histogram in python #matplotlib histogram
#python data visualization #create histogram using matplotlib
#data visualization tutorial #python plotting tutorial #step by step python tutorial #python for beginners #python histogram chart #numpy histogram python #custom histogram python #data science with python #python graph tutorial #jupyter notebook plotting
-
 2:37:29
vivafrei
19 hours agoEp. 260: SCOTUS Blocks Trump Deportation? Letitia James Criminal Referral! RFK Jr. & Autism & MORE!
139K177 -
 7:30:34
iCheapshot
11 hours ago $2.66 earnedSunday Funday! |Happy Easter! | Happy 420 #BlazeIt
27.6K1 -
 2:25:04
TheSaltyCracker
9 hours agoHappy Easter ReeEEEe Stream 04-20-25
158K432 -
 2:25:28
Tundra Tactical
9 hours ago $5.40 earned$3200 ZEV HEARTBREAKER Contest!!!
48.5K2 -
 9:09:39
Delnorin Games
12 hours ago🔴 Live - Call of Duty
24.7K -
 2:19:42
THOUGHTCAST With Jeff D.
7 hours ago $0.55 earnedHAPPY EASTER! Sunday Night Game Chat with Jeff D.
16.5K1 -
 2:42:30
IsaiahLCarter
10 hours ago $7.45 earnedApostate Radio #011: The Revealing of Julie Behling
51.6K4 -
 4:22:35
a12cat34dog
11 hours agoMY 2ND YEAR OF GAMING ON RUMBLE :: LIVE VIDEO PREMIER :: THE ULTIMATE MONTAGE {18+}
58.5K20 -
 15:00
15:00
Mrgunsngear
1 day ago $10.94 earnedDan Wesson DWX: 2011 & CZ-75's Baby
111K29 -
 7:00:07
Ashaelon
14 hours ago $2.13 earnedHappy Easter Everyone! Chilling to some State of Decay 2!
21.9K1