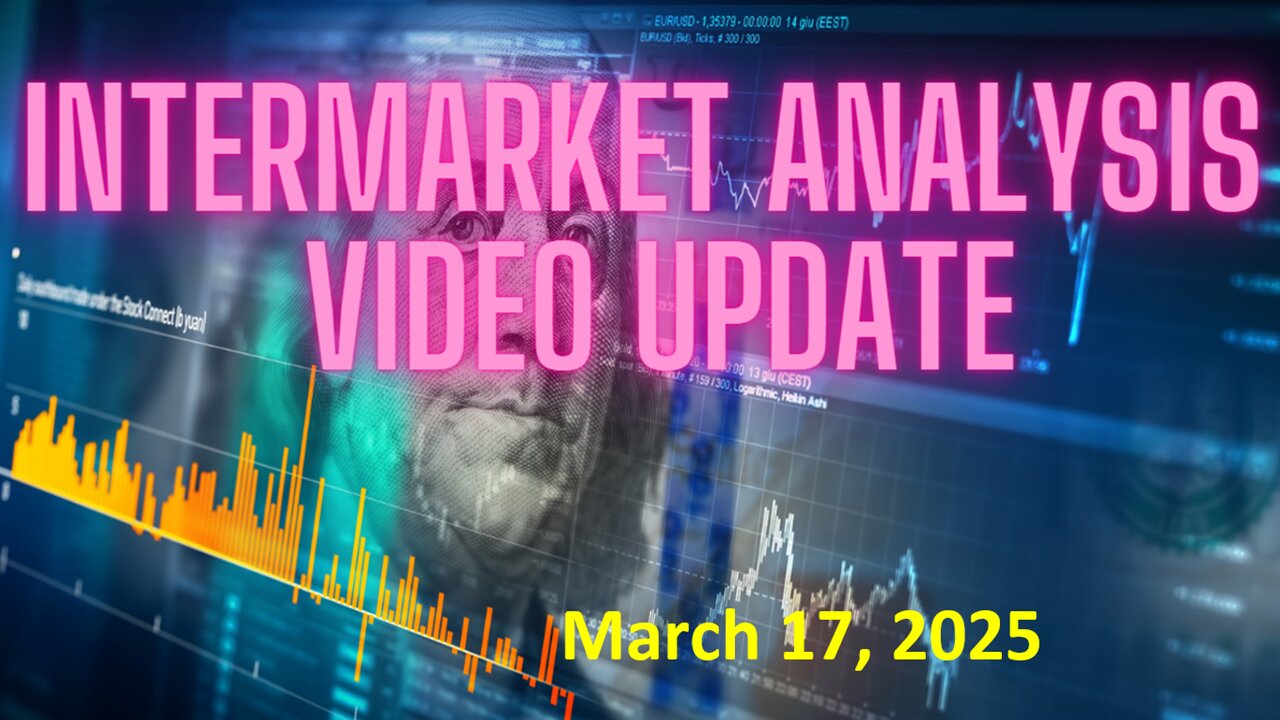
InterMarket Analysis Update for March 17, 2025
Link to The SPX Investing Program https://spxinvesting.substack.com/
Intermarket Analysis" Update, prepared for Monday, March 17, 2025, provides a comprehensive overview of factors influencing the stock market, with a focus on the S&P 500. Here's a summary of the key points:
Valuation
The market is currently perceived as overvalued, an observation that intensifies during downturns.
Historical earnings data and forward-looking projections are used to assess the S&P 500’s price-to-earnings (P/E) ratio. The current P/E suggests the market is expensive, with the S&P 500 at 5,500-5,600, far above a level (around 4,000) that would align with a P/E of 20.
The Schiller P/E ratio (CAPE), averaging earnings over 10 years, is at 35.21—well above the historical mean (17.22) and median (16), indicating an expensive market compared to historical norms and other global markets.
Growth vs. Value
Growth stocks (e.g., the "Magnificent Seven" such as Microsoft, Apple, Netflix, Google) have slowed in 2025 after strong performances in 2023-2024, pressuring the market.
Value stocks have outperformed growth recently, a shift typical during market downturns. Metrics show growth remains in an uptrend but is weakening, while value is gaining relative strength, though not enough to reverse the broader trend yet.
Inflation
Recent CPI and PPI reports indicate inflation is under control and declining. However, rising commodity prices (e.g., CRB Index in an uptrend) suggest potential inflationary pressures.
Other indicators, such as the Baltic Dry Index (downtrend but bouncing) and inflation expectations ETF (declining), present mixed signals.
Other Markets and Sectors
Commodities: Aluminum and oil are down (non-inflationary), while corn, lumber, and natural gas are up (potentially inflationary). Copper, an economic barometer, is in an uptrend, signaling optimism.
S&P 500 Sectors: Tech and discretionary (growth areas) are weakening, while staples, utilities, and financials (defensive or stable areas) are holding up better or outperforming recently.
Indexes: Small and Mid-Caps are struggling, while the S&P 500 and NASDAQ are under pressure, with the SPX equal-weight chart showing relative resilience.
Correlations and Trends
Stocks are positively correlated with the dollar and oil (all declining) and slightly negatively correlated with interest rates.
Long-term trends (e.g., monthly charts) show momentum weakening for the S&P 500 and NYSE, with global stocks outperforming U.S. stocks so far in 2025.
Positive vs. Negative Indicators
Positive (50-day MA above 200-day MA): Growth/value indexes, copper, dollar, gold, silver, mega caps, FANG, low volatility ETF, staples, Dow, NYSE, NASDAQ, mid/small/micro caps, emerging markets, Bitcoin.
Negative (50-day MA below 200-day MA): Euro, yen, pound, semiconductors (recent death cross), world bonds, corporate bonds (trend unclear).
Conclusion
The market is at a potential turning point, with high valuations, a shift from growth to value, mixed inflation signals, and weakening momentum in U.S. stocks relative to global markets. The analysis suggests caution, with key trends (e.g., growth vs. value, small caps, semiconductors) to monitor daily for signs of stabilization or further decline.
PDF of Charts and Slides used in today's video:
https://drive.google.com/file/d/1VxrLwigreLCZrXcxbY_qb5YE9QIrB141/view?usp=sharing
My Exclusive Free Workshop: The Four P's of Building a Successful Investing Program → https://spxinvesting.mailchimpsites.com
Free Stock Market Course: https://youtu.be/Bl8XZh1t3DI
Blog: https://spxinvestingblog.com
Facebook Private Group: https://www.facebook.com/groups/667271964721864
DISCLAIMER This video is for entertainment purposes only. I am not a financial adviser, and you should do your own research and go through your own thought process before investing in a position. Trading is risky!
-
 30:27
30:27
The SPX Investing Program
1 day agoDeep Dive Update for Monday March 24, 2025
50 -
 2:43:55
TimcastIRL
5 hours agoTrump Signs Order Requiring Citizenship PROOF To Vote, Democrats Will NEVER Win AGAIN | Timcast IRL
201K105 -
 4:11:17
Geeks + Gamers
7 hours agoTuesday Night's Main Event
52.3K2 -
 3:12:26
Barry Cunningham
8 hours agoPRESIDENT TRUMP EXECUTIVE ORDERS & PRESSER HIGHLIGHTS | JASMINE CROCKETT INSANITY ... MORE NEWS!
42.4K14 -
 47:54
47:54
BonginoReport
8 hours agoLesson Learned Over Leaked Group Chat (Ep. 12) - Nightly Scroll - 03/25/25
200K160 -
 1:26:47
Kim Iversen
9 hours agoU.S. Bombs Yemen, D.C. Only Cares About A Leak | UK Journalist Addresses Spy Accusation
167K107 -
 2:02:46
Slightly Offensive
6 hours ago $9.42 earnedSecurity DISASTER: Trump Admin LEAKS Bombing Plans to Atlantic Journo | Nightly Offensive
64.9K13 -
 24:09
24:09
Producer Michael
9 hours agoWE’RE GIVING AWAY LUXURY WATCHES!! (NOT CLICKBAIT)
30K11 -
 1:38:21
Redacted News
9 hours agoBREAKING! TRUMP THREATENS EGYPT WITH TWO CHOICES, BIOWEAPONS LABS IN MONTANA EXPOSED, JFK FILES
205K275 -
 1:08:49
vivafrei
16 hours agoNational Security Text Leak? Major Violation or Atlantic Fake News? Bad Trump Pick for CDC? & MORE!
161K50