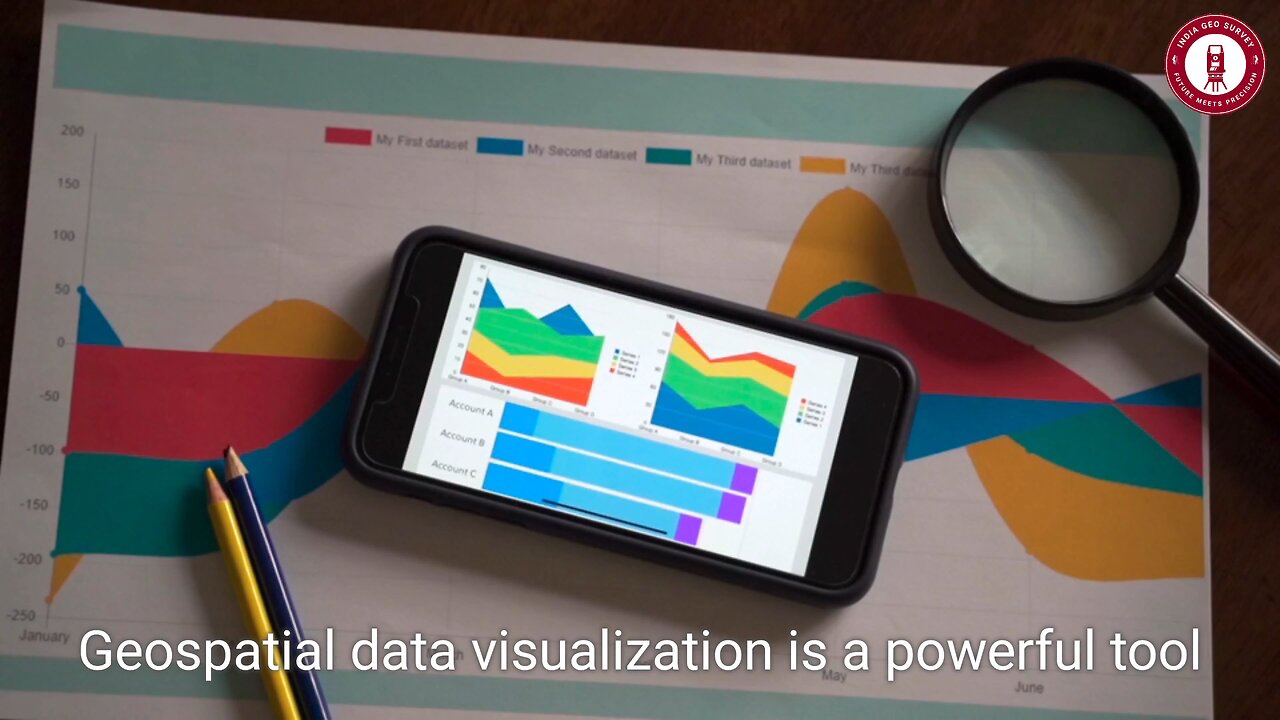
🌍 Geospatial Data Visualization – Transform Data into Powerful Insights! 📊🗺️
🚀 What if you could SEE data come to life? With Geospatial Data Visualization, raw numbers become stunning, interactive maps that reveal hidden patterns, trends, and correlations like never before! 🌍
📌 What You’ll Discover:
✅ How GIS & mapping tools turn complex datasets into actionable insights
📍 The power of layering topography, climate, demographics & more!
🔥 Heat maps, color gradients & dynamic timelines for impactful storytelling
🌎 Real-world applications in urban planning, disaster management & public policy
💡 Why It Matters:
📊 Data is everywhere! But without visualization, it’s just numbers. By mapping trends, spotting anomalies, and tracking changes over time, geospatial visualization helps industries make smarter decisions! From climate change analysis to real-time traffic monitoring, the possibilities are endless!
⚡ Want to learn how to create stunning geospatial visualizations? Watch now! 🎥
💬 How do YOU use geospatial visualization in your work? Drop a comment below! ⬇️
🔔 LIKE, SHARE & SUBSCRIBE for more cutting-edge GIS content!
💥 Hashtags:
#GeospatialData #DataVisualization #GIS #MappingTech #UrbanPlanning #DataScience #SpatialAnalysis #HeatMaps #Surveying #ArcGIS #RemoteSensing #BigData #SmartCities #GeoScience #AIinGIS
-
 LIVE
LIVE
Wendy Bell Radio
5 hours agoThe Astroturfing Of America
12,140 watching -
 1:52:53
Game On!
15 hours ago $4.74 earnedTampa Bay Welcomes Jon Gruden BACK!
39.1K -
 1:35:14
Jeff Ahern
2 hours ago $2.55 earnedFriday Freak out with Jeff Ahern ( 6am Pacific)
21.2K3 -
 20:40
20:40
Degenerate Jay
1 day ago $2.90 earnedWhy So Many Hate The Fable Game Series
37.7K3 -
 5:19
5:19
Kirill MultitoolOfficial
22 hours ago $6.07 earnedUSEFUL Survival SKILLS and SMART camping LifeHACKS in the wilderness!
47.2K4 -
 38:57
38:57
PMG
23 hours ago $4.61 earnedHannah Faulkner and Brandon Tatum | BREAKING THE CHAINS: Exposing the Left’s Manipulation
35.9K1 -
 0:50
0:50
Sean Unpaved
18 hours ago $11.82 earnedWelcome “Unpaved w/ Sean Salisbury” to Rumble
93.5K15 -
 2:10:09
FreshandFit
12 hours agoKicking Out Old Annoying Hoes In Las Vegas!
127K153 -
 25:53
25:53
Stephen Gardner
14 hours ago🔥BREAKING: Trump HATING LAWYER busted in $17 million money laundering scheme!
87.7K206 -
 20:10
20:10
CartierFamily
21 hours agoAndrew Schulz DESTROYS Charlamagne’s WOKE Meltdown on DOGE & Elon Musk!
155K116