Premium Only Content

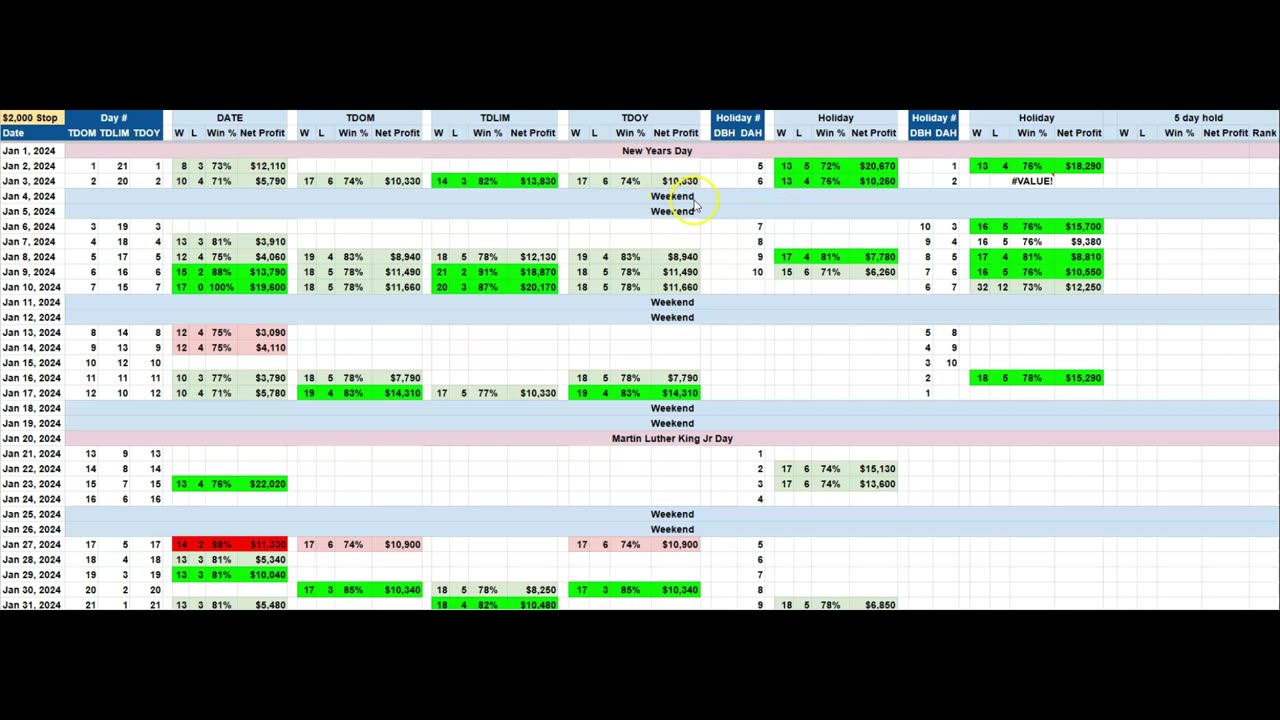
January 2025 seasonal heat map for S&P 500, Gold and Canadian dollar
https://www.simplexityanalytics.com/
This video analyses various financial markets for trading seasonal historical tendencies. The markets listed as having the #1 bullish or bearish month will have a calendar heat map on the website. Only select markets are showcased in the video.
Trading day of month TDOM, trading day of year TDOY, trading day left in month TDLIM, futures, commodities, seasonal, trading.
Disclaimer
Investment and/or Trading in any securities market is subject to market risk. Past performance is not a guarantee of future performance. The risk of loss in trading and investment in Securities markets including Equities, Derivatives, Futures and Commodities can be substantial. These are leveraged products that carry a substantial risk of loss up to and surpassing your invested capital and may not be suitable for everyone. You should therefore carefully consider whether such trading is suitable for you in light of your financial condition. Please ensure that you understand fully the risks involved and only invest money according to your risk threshold. Simplexity Analytics and associate companies does not guarantee any returns in any of its products or services. Investment in markets are subject to market risk. Hence, Simplexity Analytics and its associates are not liable for any losses in any case. All our services are nonrefundable.
-
 LIVE
LIVE
LFA TV
18 hours agoMAGA WRECKING BALL ON USAID | CULTURE WARS 2.6.25 2pm
1,311 watching -
 LIVE
LIVE
The Dana Show with Dana Loesch
2 hours agoTRUMP SIGNS EO PROTECTING WOMEN'S SPORTS | The Dana Show LIVE On Rumble!
628 watching -
 24:14
24:14
SLS - Street League Skateboarding
20 days agoTop Moments of Brazilian Skaters at the 2024 Super Crown: Rayssa Leal, Giovanni Vianna & more...
10.6K -
 59:24
59:24
The Dan Bongino Show
5 hours agoThey Fell Right Into Trump's Trap (Ep. 2417) - 02/06/2025
756K1.28K -
 47:26
47:26
The Rubin Report
4 hours agoBill Gates Makes ‘The View’ Crowd Go Quiet with This Chilling Warning
75.3K140 -
 DVR
DVR
CryptoWendyO
1 hour ago $0.41 earnedXRP RUMOR: RIPPLE HAS A SECRET DEAL WITH TRUMP?!
5.92K1 -
 2:02:40
Steven Crowder
6 hours agoHow USAID Spread Fake News with Your Tax Dollars & Trump Took Down Title IX
435K243 -

TheAlecLaceShow
3 hours agoGuests: Alex Marlow, Rep. Cloud & Rep. Gill | No Men In Women’s Sports | The Alec Lace Show
13.9K -
 52:02
52:02
PMG
18 hours ago $0.47 earnedHannah Faulkner and Pastor Mark Driscoll | WAKE UP CHURCH
16.3K1 -
 2:07:17
Matt Kohrs
14 hours agoMAX DEGEN TILT!!! (New Highs Incoming!) || The MK Show
72.7K3