Interest Rates in 2025: The Federal Reserve Dot Plot (Expected Value and Standard Deviation)
1 month ago
18
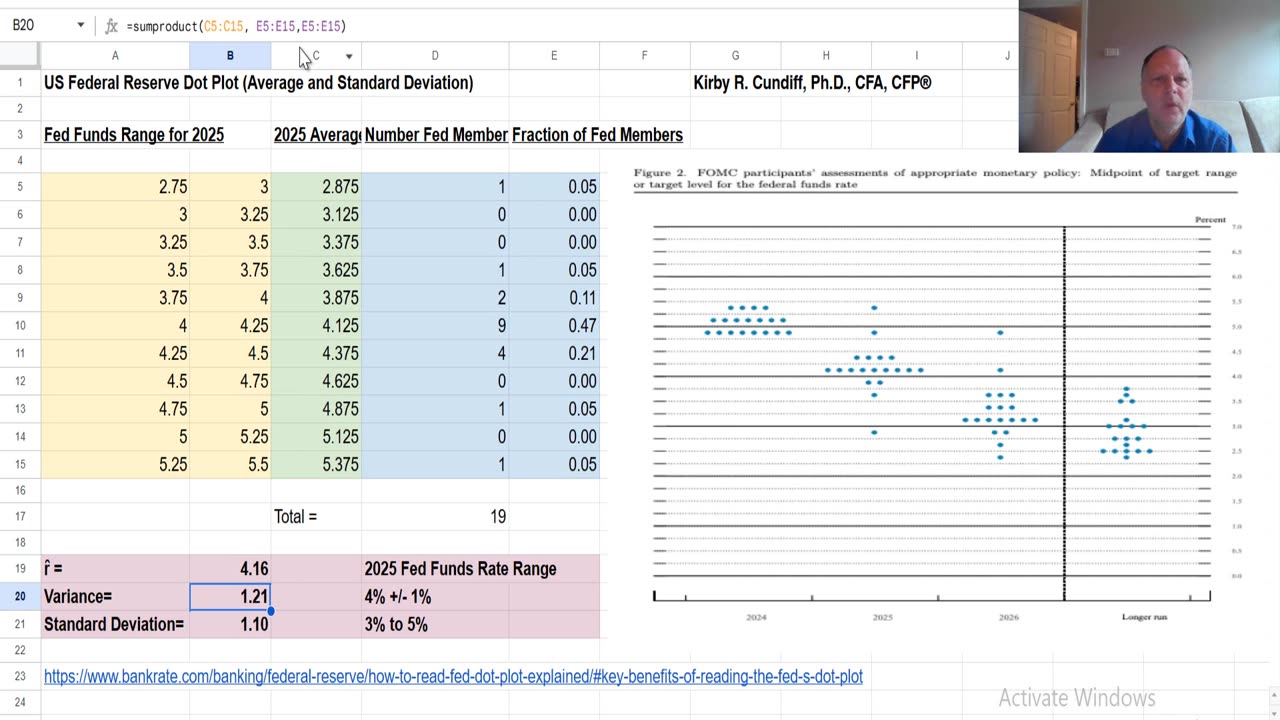
In this video we use the Federal Reserve dot plot to demonstrate how to use the Excel functions AVERAGE and SUMPRODUCT to calculate the expected value and standard deviation of the projected fed funds rate at the end of 2025. This problem is a supplement to problems in the Brigham, Financial Management text Chapter on Risk and Return Part 1.
The Fed’s dot plot is a chart that records each Fed official’s projection for the central bank’s key short-term interest rate. The dot plot is updated every three months and is meant to provide insight into the Fed’s future rate decisions, with the caveat that Fed officials can’t always predict the future.
Loading 1 comment...
-
 52:23
52:23
Candace Show Podcast
5 hours agoUPDATE! Taylor Swift Goes Full Dragon Against Blake Lively | Candace Ep 144
110K172 -
 LIVE
LIVE
VOPUSARADIO
22 hours agoPOLITI-SHOCK! KILL THE DEEP STATE!! PLUS: 3 SPECIAL GUESTS!
67 watching -
 54:41
54:41
LFA TV
1 day agoCorruption Like You Never Imagined | TRUMPET DAILY 2.6.25 7pm
25K12 -
 39:10
39:10
theDaily302
12 hours agoThe Daily 302- JJ Carrell
13.3K -
 1:20:12
Common Threads
3 hours agoLIVE DEBATE: Is Elon Musk Going Too Far with Spending Cuts?
29.3K8 -
 10:49
10:49
Misha Petrov
2 hours agoIllegal Immigrants Are Being Deported… and They’re OUTRAGED
18.1K20 -
 2:01:17
Revenge of the Cis
6 hours agoEpisode 1442: Conservative TM
57.3K7 -
 54:05
54:05
Game On!
8 hours ago $1.01 earned5 Biggest Super Bowl BET Mistakes You Might Be Making
29.1K4 -
 15:27
15:27
BlackDiamondGunsandGear
7 hours agoTOP 5 CCW / Whats your Favorite? #EDC
41.4K6 -
 1:02:21
In The Litter Box w/ Jewels & Catturd
1 day agoSCHUMER ENDORSES DOGE | In the Litter Box w/ Jewels & Catturd – Ep. 736 – 2/6/2025
99.3K60