How to Predict Reversals in Trading 📊🔄
Discover why so many successful traders trust Deriv!
🔥 Open your FREE Demo Account today: https://bit.ly/3Rnmgod
Predicting market reversals can help you catch the turning points and make profitable trades. Here's how to spot them:
1️⃣ Look for Overbought/Oversold Conditions (Indicators):
RSI (Relative Strength Index): An RSI above 70 indicates overbought conditions, while below 30 indicates oversold conditions—possible signs of a reversal.
Stochastic Oscillator: Similar to RSI, the stochastic can show overbought or oversold conditions when the value reaches extreme highs or lows.
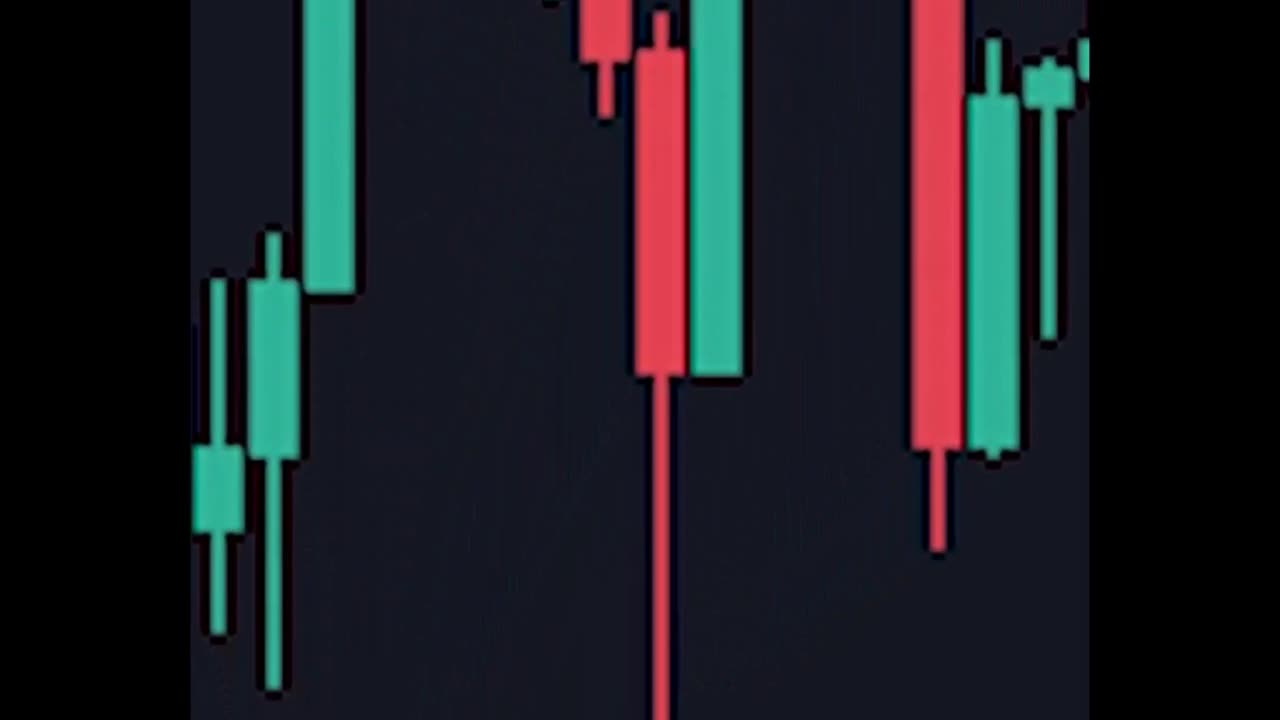
2️⃣ Candlestick Patterns:
Reversal candlestick patterns like Doji, Engulfing, Hammer, or Shooting Star can signal a potential reversal when they appear at key support or resistance levels.
3️⃣ Support and Resistance Levels:
Prices tend to reverse at key support (for buy signals) or resistance (for sell signals) zones. Watch for price rejection or consolidation at these levels.
4️⃣ Trendline Breaks:
If price breaks a trendline after showing signs of exhaustion (like lower highs in a downtrend or higher lows in an uptrend), it can indicate a reversal.
5️⃣ Divergence:
Bullish Divergence: When the price forms lower lows, but an indicator (like RSI or MACD) forms higher lows, it’s a sign of potential bullish reversal.
Bearish Divergence: When the price forms higher highs, but the indicator forms lower highs, it’s a sign of potential bearish reversal.
6️⃣ Volume Confirmation:
A reversal is stronger when it’s confirmed by higher trading volume. Low volume reversals are often weak and unreliable.
Predicting reversals isn’t foolproof, but combining multiple tools and indicators can increase your chances of success. 🧠💡
Discover why so many successful traders trust Deriv!
🔥 Open your FREE Demo Account today: https://bit.ly/3Rnmgod
#ForexTips #ReversalTrading #CandlestickPatterns #SupportAndResistance #Divergence
-
 LIVE
LIVE
BigDaddySlick78's Live Gaming Channel
5 hours ago🔴 Call Of Duty Warzone Rebirth Island & Area 99 Live w/ Subs #callofduty #warzone #bo6 #cod
188 watching -
 22:39
22:39
The Mel K Show
13 hours agoMel K & Representative Brandon Gill | Our Constitutional Republic is Being Restored | 4-26-25
75.7K55 -
 4:17:17
VapinGamers
13 hours ago $7.39 earned📣 Fortnite Family Night! - Games and Dubs with BrianZGame - !rumbot
70.7K5 -
 4:27:48
ThePope_Live
11 hours agoLIVE - First time playing The Finals in over a YEAR! Still good? with @Arrowthorn
53.3K1 -
 3:06:26
TruthStream with Joe and Scott
17 hours agoRoundtable with Patriot Underground and News Treason Live 4/26 5pm pacific 8pm Eastern
85.6K42 -
 8:52
8:52
Tundra Tactical
15 hours ago $11.14 earnedSCOTUS Denies Appeal, Minnesota Courts Deal 2a Win!
74.3K14 -
 10:36:01
a12cat34dog
17 hours agoONE WITH THE DARK & SHADOWS :: The Elder Scrolls IV: Oblivion Remastered :: FIRST-TIME PLAYING {18+}
96.7K7 -
 22:27
22:27
Exploring With Nug
1 day ago $13.52 earnedSwamp Yields a Chilling Discovery in 40-Year Search for Missing Man!
80.2K29 -
 1:23:26
RiftTV/Slightly Offensive
18 hours ago $12.66 earnedThe LUCRATIVE Side of Programming and the SECRETS of the "Tech Right" | Guest: Hunter Isaacson
82.8K38 -
 27:57
27:57
MYLUNCHBREAK CHANNEL PAGE
1 day agoDams Destroyed India
83.3K31