Premium Only Content
This video is only available to Rumble Premium subscribers. Subscribe to
enjoy exclusive content and ad-free viewing.

Candlestick Charts_ Explained in 60 Seconds!⏱️📊
2 months ago
3
Discover why so many successful traders trust Deriv!
🔥 Open your FREE Demo Account today: https://bit.ly/3Rnmgod
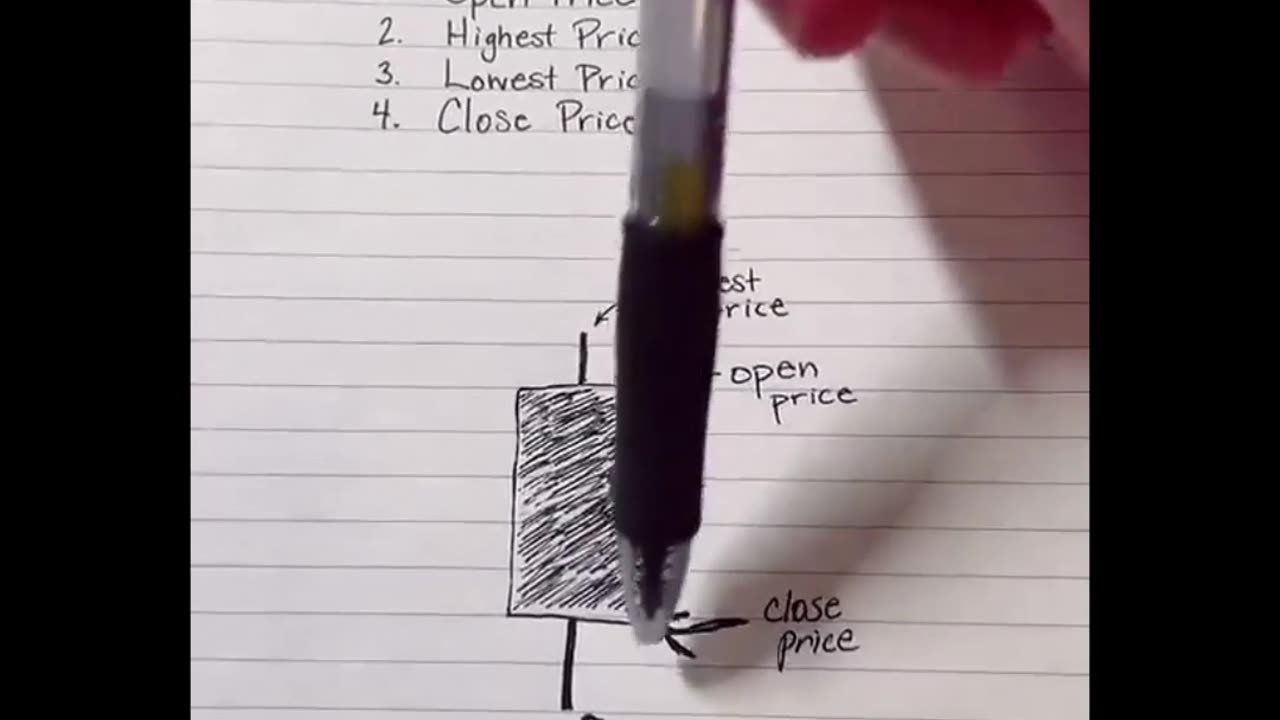
Candlestick charts show price movement over time with each 'candle' representing open, high, low, and close prices.
Bullish candle: Closes higher than it opened (green or white).
Bearish candle: Closes lower than it opened (red or black).
Wicks: Show the highest and lowest prices during that period.
Candlestick patterns like Doji, Engulfing, and Hammer can indicate potential market reversals or continuations. Master these for better entries and exits! 🚀 #CandlestickCharts #Forex #DayTrading #ChartAnalysis
Loading comments...
-
 47:50
47:50
Candace Show Podcast
6 hours agoBREAKING: Judge Makes Statement Regarding Taylor Swift's Text Messages. | Candace Ep 155
94.3K108 -
 DVR
DVR
Josh Pate's College Football Show
3 hours ago $0.29 earnedCFB’s Most Hated Teams | FSU & Clemson Future | Big Ten Win Totals | Star Rankings Overrated?
5.76K -
 1:33:47
CatfishedOnline
4 hours agoGoing Live With Robert - Weekly Recap
27.8K -
 55:18
55:18
LFA TV
1 day agoEurope’s Sudden Turn Against America | TRUMPET DAILY 3.6.25 7PM
32.2K3 -
 4:21
4:21
Tundra Tactical
4 hours ago $1.38 earnedPam Bondi MUST Enforce Due Process NOW!
18.4K1 -
 56:42
56:42
VSiNLive
5 hours agoFollow the Money with Mitch Moss & Pauly Howard | Hour 1
43.6K1 -
 1:05:32
In The Litter Box w/ Jewels & Catturd
1 day agoShalom Hamas | In the Litter Box w/ Jewels & Catturd – Ep. 756 – 3/6/2025
98.7K37 -
 1:23:00
Sean Unpaved
7 hours ago $3.19 earnedNFL Free Agency
53.4K3 -
 18:25
18:25
Stephen Gardner
6 hours ago🔥The REAL REASON the Epstein Files are being HIDDEN | I CONFRONT Alan Dershowitz for details!
63.3K111 -
 1:58:44
The Quartering
9 hours agoTrump To Charge USAID Staff, Campus RIOT Erupts, Theo Von & Candace Owens, Ukraine Gets Worse!
117K72