FP&A Course - P&L analysis (advanced)
Access FP&A Income statement analysis Course: https://ebitda.thinkific.com/pages/start
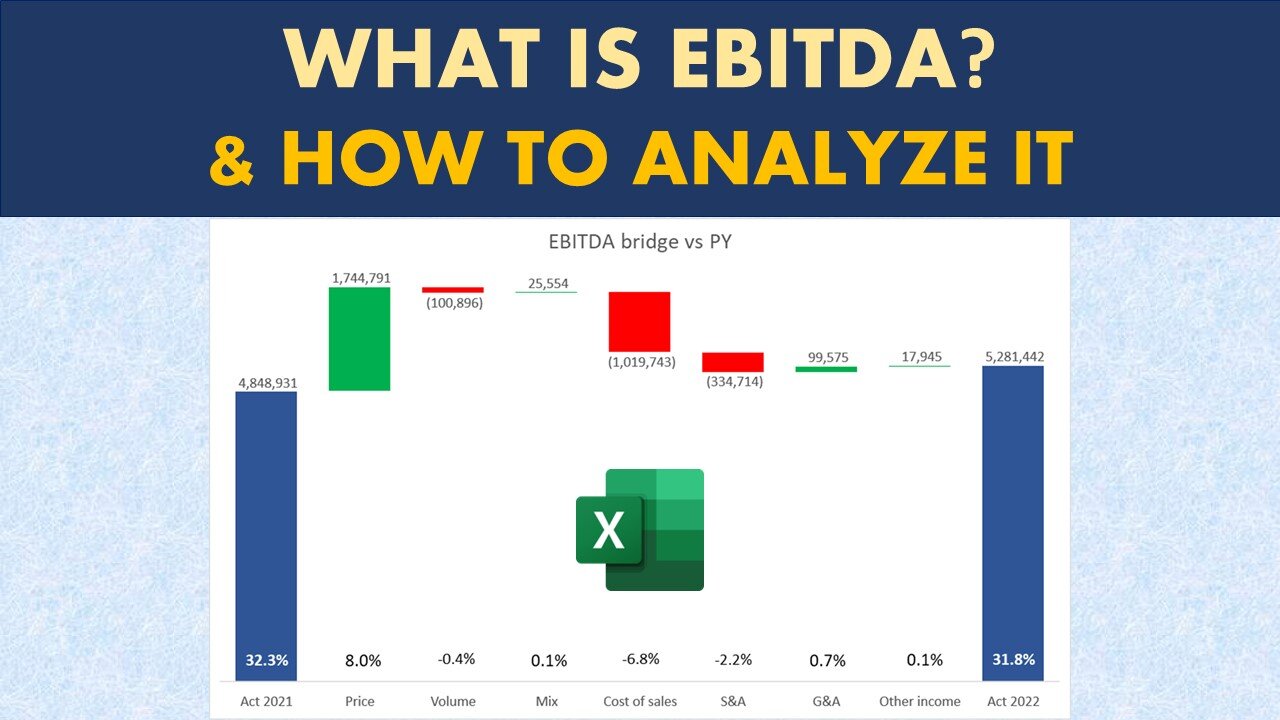
A very common mistake when analyzing income statement is to look at the variances vs previous period of target, and make assumptions of the performance based on the variances alone. This is a risky way of analyzing the income statement. This is because you have not analyzed the results thoroughly enough to understand the impact of price vs volume and mix impact. This can lead to incorrect conclusions and explaining the income statement performance incorrectly. This is why I highly recommend that you perform the price, volume, mix and cost analysis first and then proceed with making conclusions or statements on income statement performance.
If you are a financial analyst, or a business analyst, this skill is a MUST HAVE. But its not as easy as it sounds sometimes. Specially understanding the difference between volume and mix, and how price impact is calculated vs quantity (volume and mix). In the end, all the variances should add up to the difference or variance you are seeing in the income statement. A good way is to prepare a bridge or a walk for Net sales, gross profit and EBITDA, both for amount change and also for % change. This is exactly what I cover in the course in detail with examples and a downloadable excel file with calculation of all the variances, bridges and waterfall charts.
-
 1:29:04
Glenn Greenwald
6 hours agoTrump, Vance & Musk Announce a Radically New Foreign Policy Framework; Prof. Norman Finkelstein on Gaza's Future, the Cease-Fire Deal & Fallout from the U.S./Israeli War | SYSTEM UPDATE #407
77.8K63 -
 4:15:00
Nerdrotic
8 hours ago $4.85 earnedCaptain Falcon America REVIEW, Disney Ending DEI? Rings of Power RETURNS | Friday Night Tights #341
152K22 -
 9:34:03
FusedAegisTV
16 hours agoMario Galaxy, Batman, Real Talk/Politics, & MORE - V-Day 💗 Friday Variety Stream!
16.9K1 -
 1:10:49
Vigilant News Network
4 hours agoRFK Jr. Drops a Stunning Announcement | The Daily Dose
38.5K31 -
 49:49
49:49
Candace Show Podcast
8 hours agoEXCLUSIVE: Blake & Ryan’s Desperate Legal Strategy Exposed! | Candace Ep 147
156K124 -
 1:32:20
2 MIKES LIVE
5 hours ago2 MIKES LIVE #180 with guest Kyle Rittenhouse!
33.8K2 -
 9:40
9:40
Tactical Advisor
10 hours agoBest Home Defense Shotgun Build | Genesis Gen 12
31.2K -
 56:44
56:44
VSiNLive
7 hours ago $3.22 earnedFollow the Money with Mitch Moss & Pauly Howard | Hour 1
59.2K1 -
 1:05:48
The Amber May Show
10 hours ago $2.22 earnedBig Balls | You Know It's Bad When Legacy Media Reports On Big Balls | Sam Anthony
30.7K6 -
 LIVE
LIVE
SoniCentric
1 day agoEnjoy a COZY Valentine's Day Escape to Paris with the BEST blend of Romantic Music
117 watching