Premium Only Content

Independent Project 3-5 Microsoft Access - SimNet Project: The New York Department of Motor Vehicles
Independent Project 3-5
The New York Department of Motor Vehicles wants to create four queries. The first query provides summary data on the number of tickets by city and violation. The second query summarizes the total tickets by violation. The third query provides summary data for the total fines assessed against each driver who has had a ticket. Use Design view to create the summary queries. Edit these queries to add fields, aggregate functions, and sorting. Save and run the queries. Finally, create a crosstab query to count the number of tickets by primary factor in each city. To ensure consistency, the starting file is provided for you.
[Student Learning Outcomes 3.2, 3.4, 3.8, 3.9]
File Needed: NewYorkDMV-03.accdb (Available from the Start File link.)
Completed Project File Name: [First Name.Last Name]-NewYorkDMV-03.accdb
Skills Covered in This Project
Create a summary query in Design view.
Edit a query in Design view.
Add fields to a query.
Execute a query.
Save a query.
Sort query results.
Add aggregate functions.
Create a crosstab query.
Steps to complete This Project
Mark the steps as checked when you complete them.
Open the NewYorkDMV-03.accdb database start file.
The file will be renamed automatically to include your name. Change the project file name if directed to do so by your instructor.
Enable content in the database.
Create a new summary query in Design view. The query counts the number of tickets issued by city and violation.
Add the Tickets table into the Query Design window.
Increase the size of the table object to display all of the fields.
Add the following fields into the query: City, PrimaryFactor, and TicketNumber.
Add the Total row to the query.
Group By the City and PrimaryFactor fields and Count the TicketNumber field.
Save the query as TicketCountByCityAndFactor.
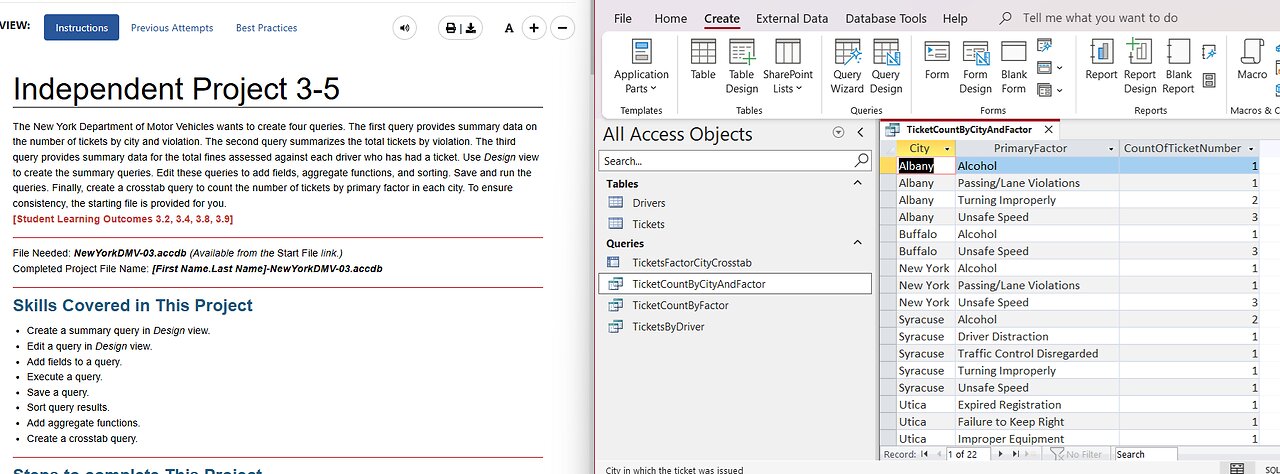
Run the query. The datasheet should display 22 records.
Adjust the field column widths using AutoFit or Best Fit. The datasheet should be similar to Figure 3-116.
Datasheet view of query results shows 22 records.
Figure 3-116 Summary query results counting tickets by city and factor
Save the changes to the query.
Save a copy of the query as TicketCountByFactor.
Edit the TicketCountByFactor query in Design view. The query should show the total tickets issued for each violation factor, sorted in descending order by count.
Delete the City field.
Sort the TicketNumber field in descending order.
Save and run the query. The datasheet should match Figure 3-117.
Datasheet view of query results shows nine records.
Figure 3-117 Summary query results counting tickets by factor
Close the query.
Create a new summary query in Design view. The query provides summary data on the total fines assessed against each driver.
Add both tables into the Query Design window.
Increase the size of the table objects to display all of the fields.
Add the following fields into the query: LicenseNumber, FirstName, LastName, Fine, and TicketNumber.
Add the Total row to the query.
Group By the LicenseNumber, FirstName, and LastName fields, Sum the Fine field and Count the TicketNumber field.
Sort the Fine field in descending order.
Save the query as TicketsByDriver.
Run the query. The datasheet should display 23 drivers who have received tickets, sorted in descending order by the total dollar amount of their fines (Figure 3-118).
Datasheet view of query results
Figure 3-118 Summary query results of tickets by driver
Close the query.
Create a crosstab query to count the number of tickets by city and primary factor.
Launch the Query Wizard, select Crosstab Query Wizard and click OK. Refer back to SLO 3.9: Understanding and Building a Crosstab Query if you need additional guidance.
Select the Tickets table, on the first page of the wizard, because that contains the data you want to summarize.
Move the PrimaryFactor field to the Selected Fields window, on the second page of the wizard, to use as the row headings.
Select the City field, on the third page of the wizard, to use as the column headings.
Select the TicketNumber field and the Count aggregate function, on the fourth page of the wizard. Leave the Yes, include row sums check box selected.
Enter TicketsFactorCityCrosstab as the query name on the last page of the wizard. Click Finish to execute the query. The results should match those shown in Figure 3-119.
Datasheet view of crosstab query results showing tickets by primary factor in each city, including row sums
Figure 3-119 Crosstab query results showing tickets by primary factor in each city, including row sums
Save and close the query.
Close the database.
Upload and save your project file.
Submit project for grading.
#MicrosoftAccess
#Access
#SimNet
#Project
-
 LIVE
LIVE
Phyxicx
7 hours agoWe're streaming again! - 11/26/2024
197 watching -
 LIVE
LIVE
GamingWithHemp
7 hours agoHanging with Hemp #103
1,305 watching -
 21:24
21:24
DeVory Darkins
1 day ago $10.23 earnedElon Musk and Tucker Carlson SHATTER Left Wing Media
36.5K36 -
 15:13
15:13
Stephen Gardner
4 hours ago🔥Breaking: Trump JUST DID the UNEXPECTED | Tucker Carlson WARNS America!
31.6K71 -
 1:18:01
Glenn Greenwald
9 hours agoWill Trump's Second Term Promote Economic Populism? Matt Stoller On Cabinet Picks To Fight Corporate Power; Should Liberals Cut Off Pro-Trump Friends & Family? | SYSTEM UPDATE #372
172K188 -
 2:26:30
WeAreChange
9 hours agoTrump To Subdue Deranged Opposition! ARRESTS Planned
134K56 -
 1:19:04
JustPearlyThings
10 hours agoWhy MODERN WOMEN Keep REJECTING The Redpill! | Pearl Daily
103K56 -
 1:15:03
Man in America
11 hours agoBig Pharma EXPOSED: The HIDDEN Cures They Tried to Bury
35.8K13 -
 2:18:12
VikingsOutlawsAndCowboys
12 hours agoVOC SHOW LIVE - #9
12.3K1 -
 43:22
43:22
PMG
1 day ago $6.22 earned"Sean Parnell Speaks Out for Tulsi Gabbard and Pete Hegseth; J6 Pardons Needed"
25.9K7