Premium Only Content

Cooperative Business Analytics with Power BI
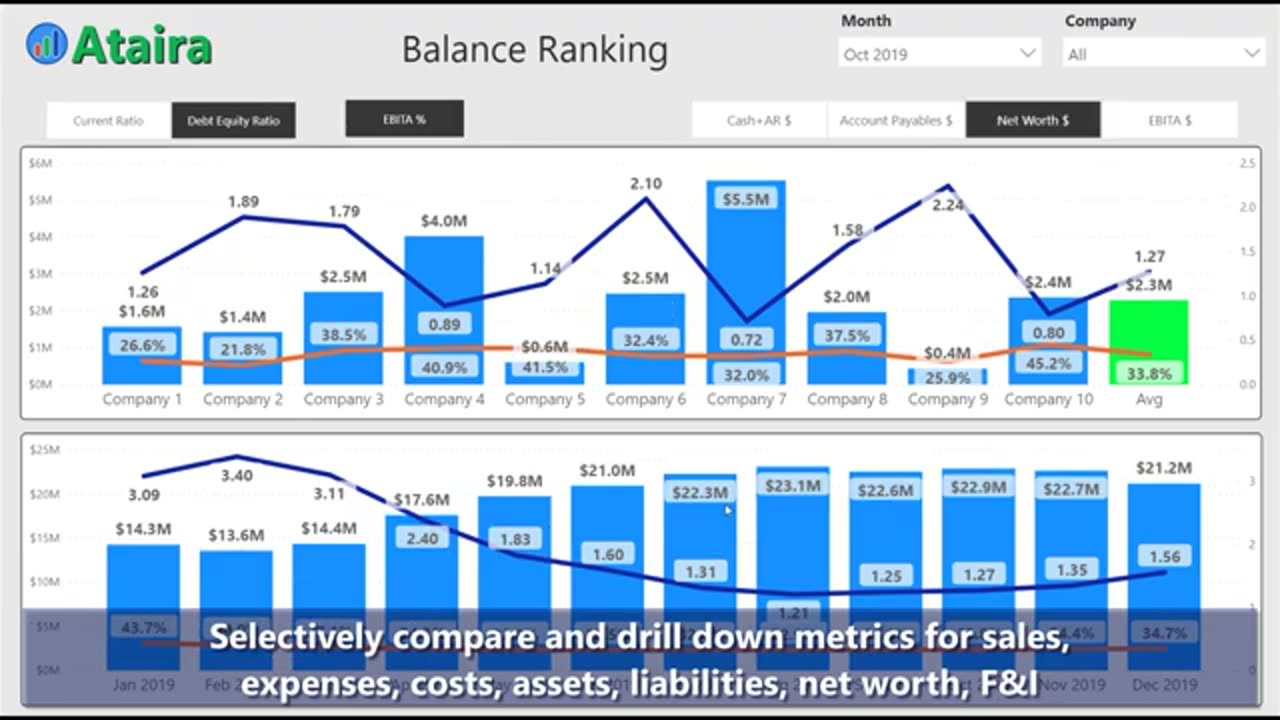
Compare P&L and Balance Sheet metrics across companies, organizations, franchisees, departments, associations or any group of entities across a similar set of financial metrics for cooperative performance improvement.
When companies pool their data it provides visibility into market metrics relative to a much larger organization. By comparing performance, individual organizations can understand best practices and performance opportunities for the group.
Features of the Group Financial template include:
• Common P&L metrics for sales, costs, expenses, gross & net profit
• Balance sheet metrics for receivables, payables, net worth, current & debt ratio
• Comparison of metrics by YTD, month, previous periods
• Selectively compare and drill down metrics for sales, expenses, costs, assets, liabilities, net worth, F&I
• Compare individual entities to average, variances from previous periods, performance thresholds
Easily integrate custom accounting codes, industry, demographics or other external data for even more visibility into process improvement and actionable insights.
-
 LIVE
LIVE
Timcast
22 minutes agoMass EU Power Outage Sparks Fear Of GLOBAL SOLAR DISASTER, Cyberattack RULED OUT
1,159 watching -
 LIVE
LIVE
Steven Crowder
2 hours ago🔴 Exposing 3 Major Anti-Trump LIES - What You Need to Look For
80,981 watching -
 LIVE
LIVE
The Rubin Report
1 hour agoHost Gets Visibly Angry as His Trap for Trump Backfires
3,056 watching -
 LIVE
LIVE
The White House
1 hour agoPresident Trump Participates in a Cabinet Meeting, Apr. 30, 2025
1,592 watching -
 LIVE
LIVE
Benny Johnson
1 hour agoLIVE Trump Cabinet Meeting Right Now in White House, Trump Torching Media | Michelle Obama MELTDOWN
7,767 watching -
 UPCOMING
The Shannon Joy Show
1 hour ago🔥🔥100 Day SHOCKER - Trump Is Deporting FEWER Illegal Immigrants Than Biden! He’s Also Pimping Biden’s mRNA & Fast Tracking Self-Amplifying mRNA Shots! With Special Guests John Beaudoin Sr. & Jessica Rose🔥🔥
94 -
 LIVE
LIVE
Right Side Broadcasting Network
3 hours agoLIVE: President Trump Holds a Cabinet Meeting - 4/30/25
4,978 watching -
 LIVE
LIVE
BitLab Academy
2 hours agoCrypto DIP ALERT! Bitcoin & Atcoins: Sell In May? Crypto Pump or Dump Next!?
140 watching -
 UPCOMING
Dr David Jockers
1 hour agoHow Sourdough Bread Impacts Blood Sugar and Gut Health!
26 -
 1:00:37
VINCE
3 hours agoMedia Lies On Trump's 100 Days | Episode 33 - 04/30/25
150K90