Premium Only Content
This video is only available to Rumble Premium subscribers. Subscribe to
enjoy exclusive content and ad-free viewing.

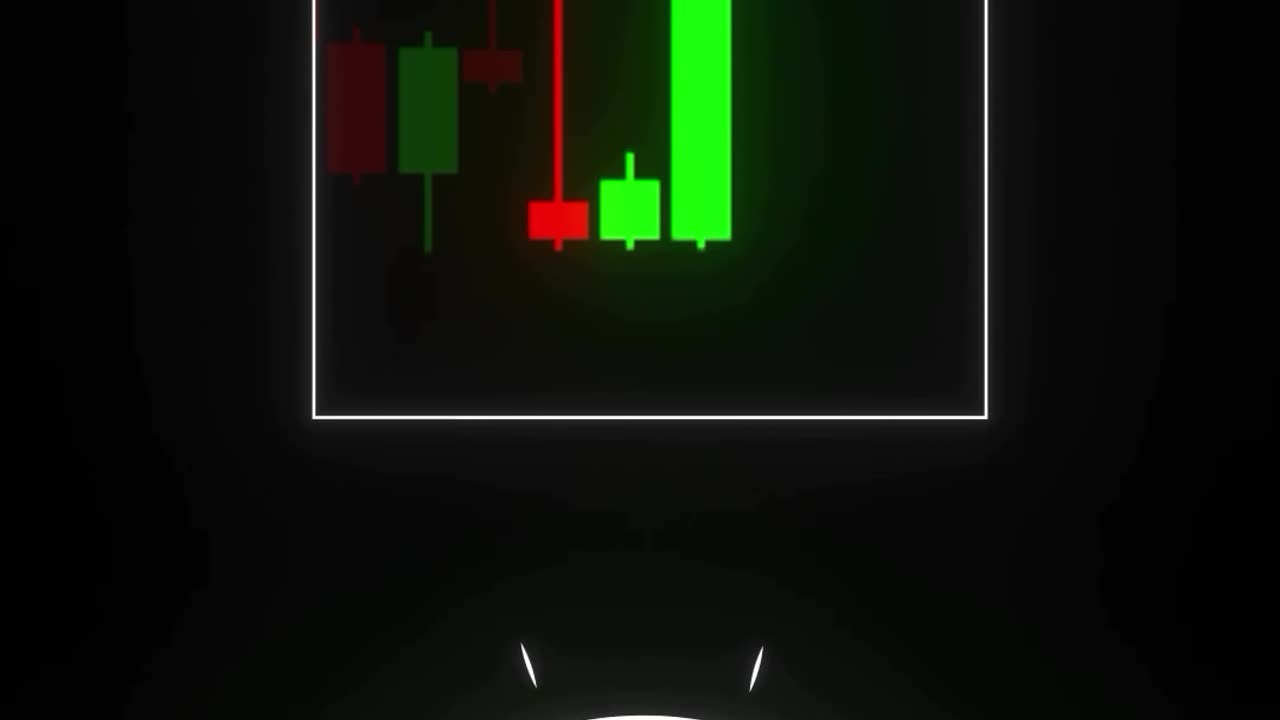
CANDLE STICK PATTERN Part-2 _ WOWWWW
8 months ago
9
Candlestick charts originated in Japan over 100 years before the West developed the bar and point-and-figure charts. In the 1700s, a Japanese man named Homma discovered that, while there was a link between price and the supply and demand of rice, the markets were strongly influenced by the emotions of traders.
1
Candlestick charts show that emotion by visually representing the size of price moves with different colors. Traders use the candlesticks to make trading decisions based on irregularly occurring patterns that help forecast the short-term direction of the price.
Loading comments...
-
 12:01
12:01
T-SPLY
9 hours agoBREAKING - Jasmine Crockett Under Investigation For Fraudulent Campaign Donations
33.3K36 -
 39:07
39:07
Steph & Kayls
7 hours agoFrom Spicy Content to Sleepless Nights: The Chaos of Being First-Time Parents & Creators | Ep. 1
28.3K4 -
 1:36
1:36
Nick Shirley
9 hours ago $2.69 earnedThese Anti-Trump and Elon Protesters are Idiots
35.8K49 -
 17:08
17:08
World2Briggs
1 day ago $1.59 earned10 Worst Cities to Move if You Hate Yourself.
27.6K9 -
 13:32
13:32
megimu32
1 day agoKitKat vs. Twix: One Breaks, One Bites… Who Wins?
29.7K12 -
 24:04
24:04
Link to the Light
21 hours ago $0.51 earnedTop 10 Most Anticipated Games of 2025 - Link to the Light
18.6K3 -
 23:00
23:00
Ohio State Football and Recruiting at Buckeye Huddle
20 hours agoOhio State Football: Spring Game Recap | Biggest Concerns for Buckeyes?
12.1K -
 11:57
11:57
Fit'n Fire
7 hours ago $0.28 earnedGriffin Armament Dual-Lok HRT-762 First Looks
8.79K1 -
 11:23
11:23
ariellescarcella
1 day agoHere's What Happens To 'Trans Kids' : 15 Year Study Reveals ALL
7.67K20 -
 1:04
1:04
Memology 101
6 hours ago $0.44 earnedOut of touch MULTI-MILLIONAIRE wants YOU paying MORE TAXES to own Trump
5.68K17