Premium Only Content
This video is only available to Rumble Premium subscribers. Subscribe to
enjoy exclusive content and ad-free viewing.

QuickTip 95 | Drawing a rectangle between two times and prices
Repost
4 months ago
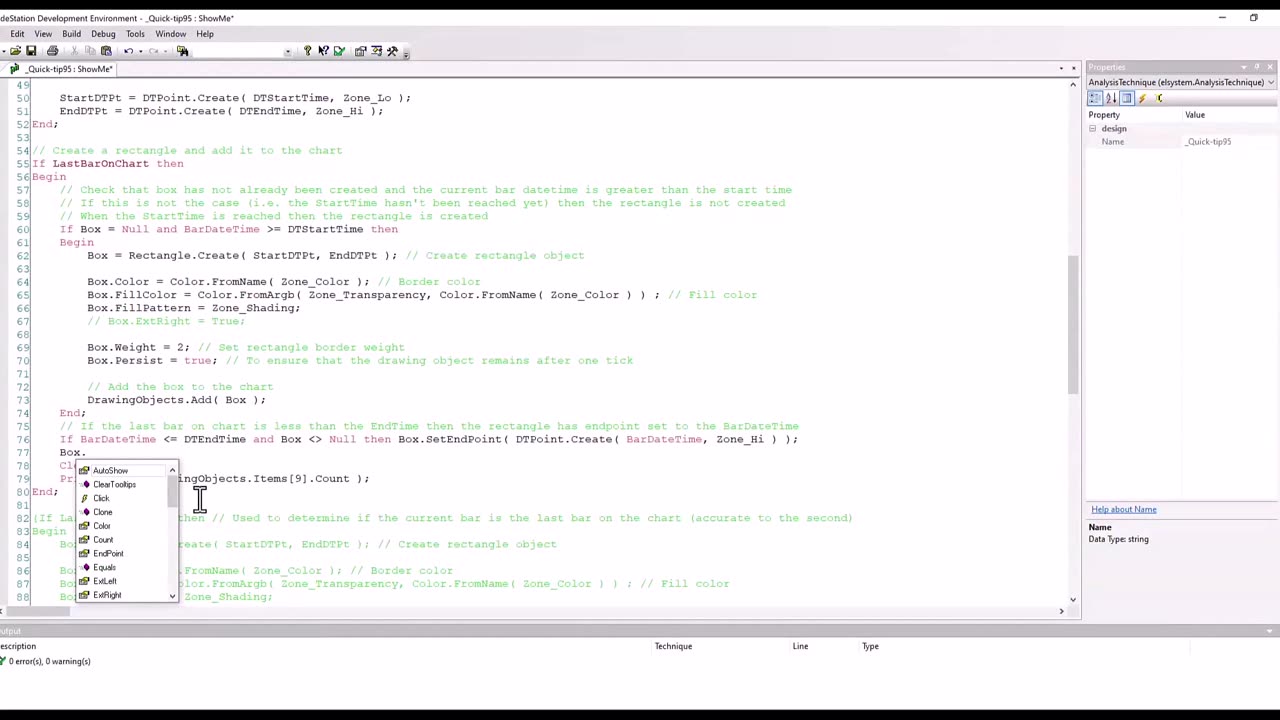
Quick-tip 95 explains how to draw a rectangle on a chart between two times. In the first part of the tutorial I demonstrate simple syntax to draw a rectangle. I also explain a couple of potential problems. In the second part of the tutorial I explain how these problems may be resolved.
The quick-tip also explains how to convert dates and time to DateTime format and how to created DateTime points.
Loading comments...
-
 23:38
23:38
RealitySurvival
1 day agoBest Anti-Drone Rounds For Self Defense
8.08K2 -
 57:43
57:43
barstoolsports
14 hours agoBest Shot Wins The Game | Surviving Barstool S4 Ep. 7
199K9 -
 1:52:24
Kim Iversen
10 hours agoLuigi Mangione Charged With TERRORISM | Liz Cheney Accused Of WITNESS TAMPERING, Faces 20 YEARS IN JAIL
105K133 -
 6:50:10
Akademiks
11 hours agoJay Z says he aint NEVER been friends w/ DIDDY! Bhad Bhabie lost her man? Travis Hunter Down Bad?
110K13 -
 2:27:04
AirCondaTv Gaming
9 hours ago $23.47 earnedWar Thunder - Tankering Around for That 10 Bomb
56.1K5 -
 4:19:05
SpartakusLIVE
12 hours agoThe MACHINE locks in for 12-hour POWER stream
37.1K1 -
 1:58:40
Robert Gouveia
11 hours agoJ6 Coverup: Prosecute LIZ CHENEY; NY Judge REJECTS Immunity; Trump Breaks Gag?
172K77 -
 2:22:06
WeAreChange
10 hours agoPSYOP Spreads: Drones Shut Down Airport In New York!
109K50 -
 1:31:18
Redacted News
12 hours agoEMERGENCY! NATO AND CIA ASSASSINATE TOP RUSSIAN GENERAL, PUTIN VOWS IMMEDIATE RETALIATION | Redacted
248K455 -
 56:45
56:45
VSiNLive
11 hours ago $7.13 earnedFollow the Money with Mitch Moss & Pauly Howard | Hour 1
89.4K2