Premium Only Content

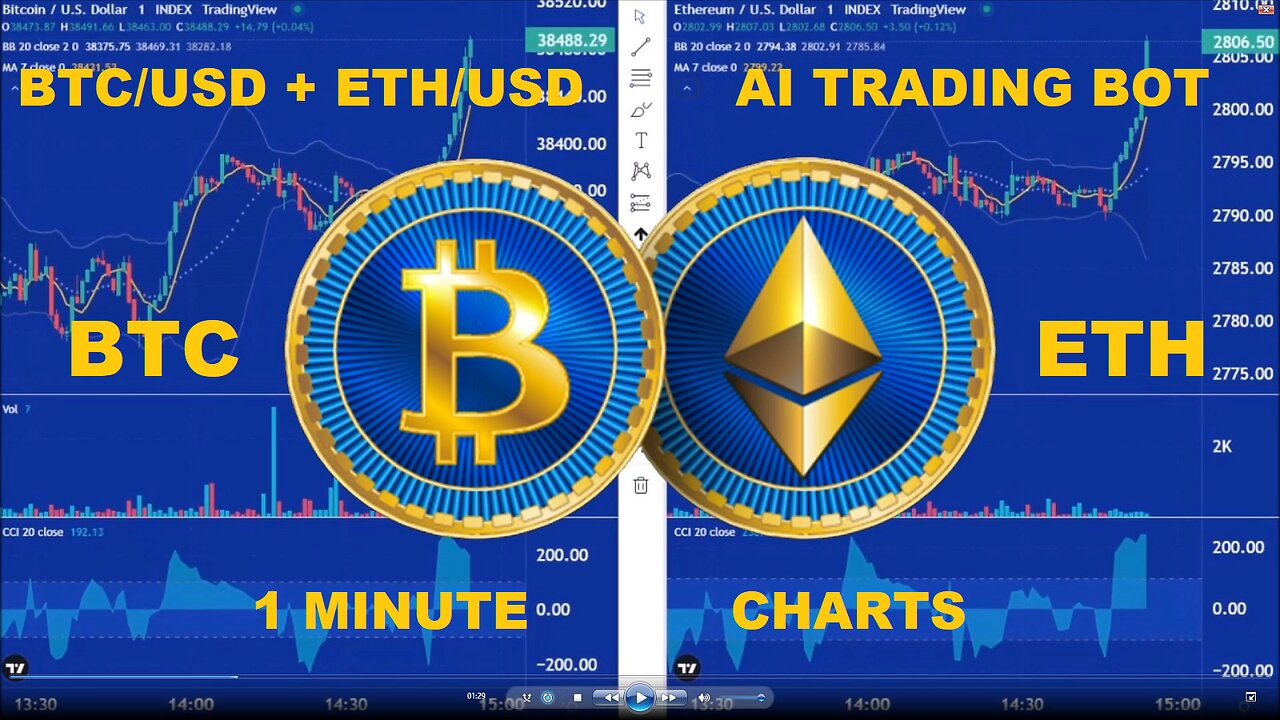
LIVE - AI Trading Bot - Bitcoin + Ethereum - 1 Minute Chart
These buy and sell signals are automatically generated by an AI trading bot I created using the pine script coding language that can only be used on TradingView.com's charts.
Here is the code for you to use and modify:
//@version=5
indicator("CCI.200.LONG.SHORT", overlay=true)
// Calculate CCI
length = input.int(150, title="CCI Length")
cci_value = ta.cci(close, length)
//Define +100 line buy and sell conditions
buy_signal_pos100 = ta.crossover(cci_value, +100)
sell_signal_pos100 = ta.crossunder(cci_value, +100)
// Define zero line buy and sell conditions
buy_signal_zero = ta.crossover(cci_value, 0)
sell_signal_zero = ta.crossunder(cci_value, 0)
// Define -100 line buy and sell conditions
buy_signal_neg100 = ta.crossover(cci_value, -100)
sell_signal_neg100 = ta.crossunder(cci_value, -100)
// Plot buy and sell signals on CCI with text labels
// LONG reverses a SHORT position. SHORT reverses a LONG position
// If there is a yellow SHORT followed by an orange SHORT followed by a red SHORT, the next LONG reverses all three
// Yellow SHORT occurs when the CCI drops below +100
plotshape(series=buy_signal_pos100, title="Buy Signal (Above +100)", location=location.belowbar, color=color.green, style=shape.triangleup, size=size.small, text="LONG", textcolor=color.green, offset=0)
plotshape(series=sell_signal_pos100, title="Sell Signal (Below +100)", location=location.abovebar, color=color.yellow, style=shape.triangledown, size=size.small, text="SHORT", textcolor=color.yellow, offset=0)
// Orange SHORT occurs when the CCI drops below 0.00
plotshape(series=buy_signal_zero, title="Buy Signal (Crossover Zero)", location=location.belowbar, color=color.green, style=shape.triangleup, size=size.small, text="LONG", textcolor=color.green, offset=0)
plotshape(series=sell_signal_zero, title="Sell Signal (Below +100)", location=location.abovebar, color=color.orange, style=shape.triangledown, size=size.small, text="SHORT", textcolor=color.orange, offset=0)
// Red SHORT occurs when the CCI drops below -100
plotshape(series=buy_signal_neg100, title="Buy Signal (Below -100)", location=location.belowbar, color=color.green, style=shape.triangleup, size=size.small, text="LONG", textcolor=color.green, offset=0)
plotshape(series=sell_signal_neg100, title="Sell Signal (Above -100)", location=location.abovebar, color=color.red, style=shape.triangledown, size=size.small, text="SHORT", textcolor=color.red, offset=0)
-
 11:44:33
Day Trading Cryptos
5 months agoThe Best Crypto Charts of the Day
197 -
 2:06:43
Jewels Jones Live ®
1 day ago2025 STARTS WITH A BANG! | A Political Rendezvous - Ep. 104
101K38 -
 4:20:41
Viss
13 hours ago🔴LIVE - PUBG Duo Dominance Viss w/ Spartakus
80.3K9 -
 10:15:14
MDGgamin
16 hours ago🔴LIVE-Escape From Tarkov - 1st Saturday of 2025!!!! - #RumbleTakeover
65.3K2 -
 3:54:19
SpartakusLIVE
12 hours agoPUBG Duos w/ Viss || Tactical Strategy & HARDCORE Gameplay
76.6K1 -
 5:54:54
FRENCHY4185
13 hours agoFRENCHY'S BIRTHDAY BASH !!! THE BIG 40 !!!
85.5K3 -
 1:23:33
Michael Franzese
21 hours agoThings to look forward to in 2025
103K59 -
 3:23:02
I_Came_With_Fire_Podcast
22 hours agoDefeating VICTIMHOOD: Advocacy, Resiliency, and Overcoming Abuse
107K19 -
 2:00:56
Game On!
1 day ago $10.59 earnedNFL Experts debate if Joe Burrow will make HISTORY in Week 18!
119K16 -
 2:07:57
InfiniteWaters(DivingDeep)
4 days agoHOW TO ENTER 2025 LIKE A BOSS!
46.8K1