FET AI Ready For a Huge Pump? Bullish Daily Divergence AGAIN....10/15/23 Degen Dynasty
Join our free discord for daily live charting AMA @8PM Central Daily
https://discord.gg/XCzdZRa2mg
Interested in Gann style (law of vibration) trading? Join us on trading view at
https://www.tradingview.com/u/Cryptop...
Description:
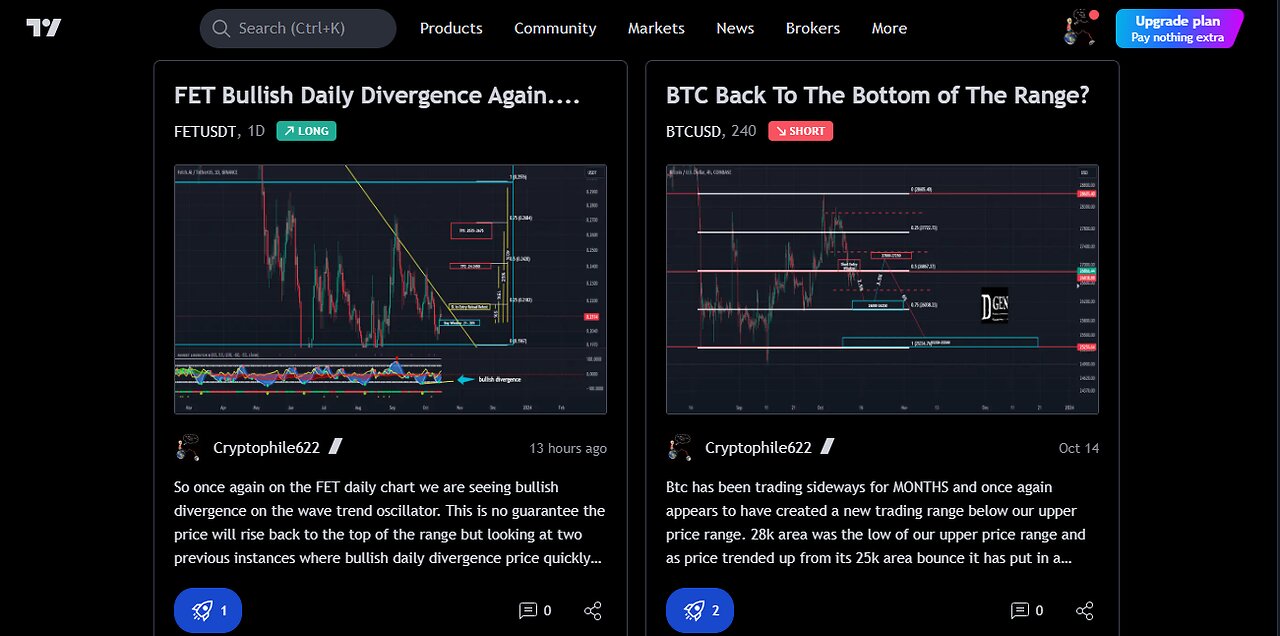
So once again on the FET daily chart we are seeing bullish divergence on the wave trend oscillator. This is no guarantee the price will rise back to the top of the range but looking at two previous instances where bullish daily divergence price quickly moved to the top its local daily range and chopped sideways and retraced back to the bottom.
Currently we have seen the first move up on this daily divergence and looking for a pull back to the last lower time frame support resistance flip to look for bullish signals in the 0.21-0.205 area. Solid entry signals would be looking at lower time frames such as the hourly for price to hit this area wick back, maybe an engulfing candle, and or bullish divergence on the small time frames.
On this daily chart we have clearly defined the average range thus far and split this range into quarters. As usual price has respected these levels quite nicely.
Knowing how high price will rise or fall is simply not part of reality but considering past performance and key price levels should certainly be part of our trading plans.
Current trading plan is to wait for price to pull back to the .21-.205 area and take a long entry IF the bullish signal is provided via candle stick pattern or divergence ONLY at this key support resistance flip level.
Targets will equal divisions of the range. Being we are currently in the bottom 25% of the range with bullish daily signals we should be looking to close in the upper 25% or the range but not being greedy and taking profit along the way at known key resistance levels.
Trade Well......
-
 LIVE
LIVE
BonginoReport
3 hours agoPothole Pete Blames Plane Crash in Canada on Trump (Ep.142) - 02/18/2025
11,271 watching -
 LIVE
LIVE
Wendy Bell Radio
4 hours agoCHECKMATE
10,069 watching -
 LIVE
LIVE
Graham Allen
2 hours agoDOGE Is Going After The IRS!! Mass Firing Soon!! + ANOTHER Plane Crash! We Are Not Safe…
5,168 watching -
 LIVE
LIVE
Chicks On The Right
3 hours agoCrazy plane crash, crazy lib protests, and Deborah Birx can suck it
1,948 watching -
 1:10:14
Game On!
16 hours ago $1.62 earnedPresident Trump's plan to Make the Super Bowl Great Again!
18.2K1 -
 1:00:33
inspirePlay
15 hours ago $2.86 earned🏌️♂️ 3 Joes vs 1 Pro Golfer – You Won’t Believe This Ending! 🤯🔥
23.3K1 -
 20:47
20:47
MTNTOUGH Fitness Lab
22 hours agoDELAYED: Kyrgyzstan Ibex Hunt | A MTNTOUGH Original
35.3K -
 59:50
59:50
Trumpet Daily
21 hours ago $6.04 earnedThe End of the Trans-Atlantic Alliance - Trumpet Daily LIVE | Feb. 17, 2025
21.8K21 -
 52:05
52:05
PMG
13 hours ago $1.54 earnedWhat Does Freedom Cost? Steven Solomon's On-the-Ground Documentary in Ukraine
37.3K -
 2:38:54
TimcastIRL
13 hours agoElon Secret Child Scandal ERUPTS, Ashley St. Clair Story Goes Viral w/Bethany Mandel | Timcast IRL
194K131