Premium Only Content

Momentum Slowing, Divergences Growing: What Does This Mean For The Markets?
🟢 TRADE IDEAS & DISCORD: https://www.patreon.com/figuringoutmoney
🟢 TRADE WITH IBKR: http://bit.ly/3mIUUfC
🟢 BOOKMAP DISCOUNT (PROMO CODE "BM20" for 20% off the monthly plans): https://bookmap.com/members/aff/go/figuringoutmoney?i=79
__________________________________________________________________________________________
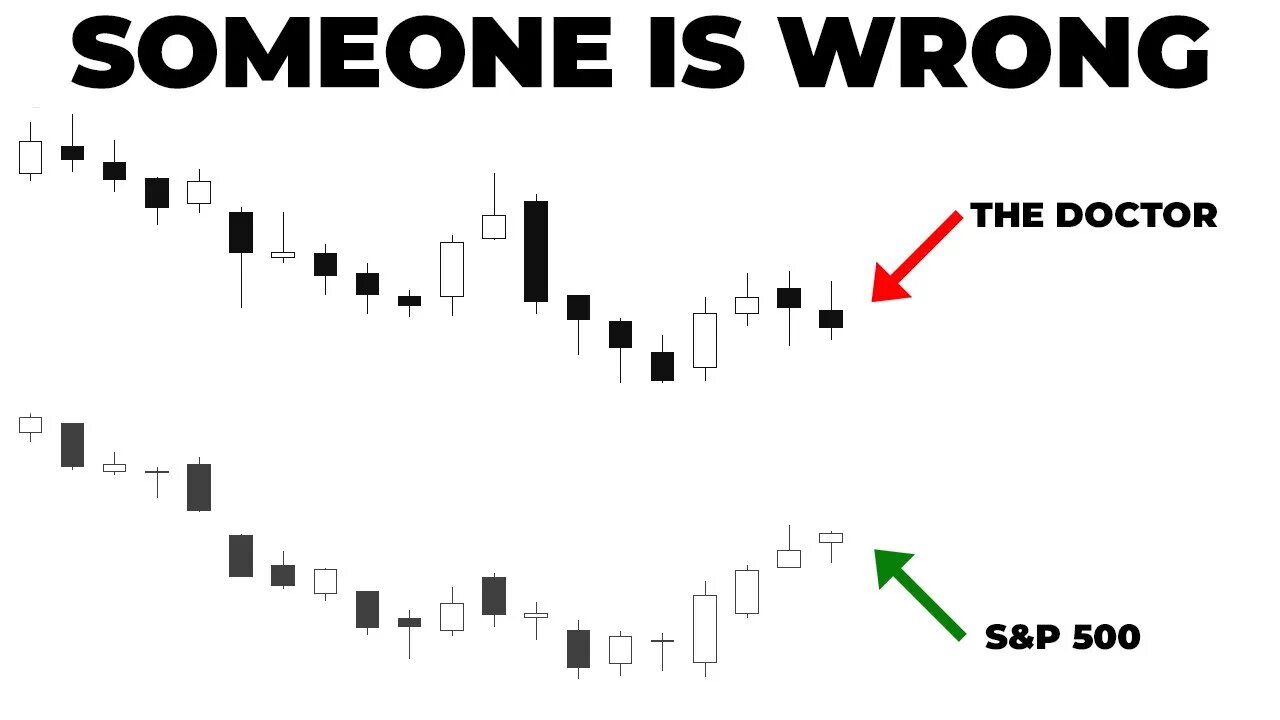
Tonight's video delves into a comprehensive analysis of the financial markets, emphasizing the slowing momentum and building divergences. It begins by highlighting the release of the producer price inflation data, which surprisingly came in hotter than expected. Despite this revelation, the markets showcased a relatively flat performance. The volatility index (VIX) and the various sectors within the S&P 500 are discussed, shedding light on their recent movements. The narrative then shifts to the 10-year yield, which has been moving within a defined channel, and the TLT (a bond ETF) that has been navigating against declining moving averages. An intriguing aspect of the script is its focus on the divergences observed in the market. These divergences, especially between high yield and equity markets as well as between copper and the S&P 500, are flagged as potential warning signs. The movement of the dollar is also explored, emphasizing its correlation with the S&P 500. Other assets, including oil, gold, Bitcoin, and Ethereum, are touched upon, providing insights into their recent trajectories and the factors influencing them. Delving deeper into technical analysis, the script underscores the nuances of candlestick charting, particularly the diminishing momentum evident from the decreasing body sizes of consecutive green candles. The significance of expected move levels and potential resistance points in the market are also highlighted. Concluding the analysis, the script offers a short-term outlook for the markets, stressing the importance of the impending inflation data and its potential ramifications on market movements.
🔔 Subscribe now and never miss an update: https://www.youtube.com/c/figuringoutmoney?sub_confirmation=1
📧 For business inquiries or collaboration opportunities, please contact us at FiguringOutMoney@gmail.com
📈 Follow us on social media for more insights and updates:
🟢 Instagram: https://www.instagram.com/figuringoutmoney
🟢 Twitter: https://twitter.com/mikepsilva
______________________________________________________________________________________________
How To Predict How Far Stocks Can Go (EXPECTED MOVES):
○ https://youtu.be/JT32L89ZpEk
Saylor To Schiff Bitcoin Indicator:
○ https://youtu.be/zuG9Tjnud9k
Show Me The Money Scan:
○ https://youtu.be/dzRjEuUUb5g
Party Starter Scan:
○ https://youtu.be/zzaN91gcJOI
Bouncy Ball Scan:
○ https://youtu.be/7xKOo6vNaq8
Dark Money Scan:
○ https://youtu.be/ZUMuHaSg1ro
Sleepy Monster Scan:
○ https://youtu.be/C9EQkA7uVU8
High Volatility Scan:
○ https://youtu.be/VC327ko8DfE
______________________________________________________________________________________________
DISCLAIMER: I am not a professional investment advisor, nor do I claim to be. All my videos are for entertainment and educational purposes only. This is not trading advice. I am wrong all the time. Everything you watch on my channel is my opinion. Links included in this description might be affiliate links. If you purchase a product or service with the links that I provide I may receive a small commission. There is no additional charge to you! Thank you for supporting my channel :)
#Stockmarket #StockMarketAnalysis #DayTrading
-
 24:50
24:50
Figuring Out Money
1 year ago $0.01 earnedThe Stock Market's Biggest Competitor Is Looking Better And Better.
55 -
 1:31:18
Redacted News
5 hours agoEMERGENCY! NATO AND CIA ASSASSINATE TOP RUSSIAN GENERAL, PUTIN VOWS IMMEDIATE RETALIATION | Redacted
183K233 -
 56:45
56:45
VSiNLive
4 hours ago $4.64 earnedFollow the Money with Mitch Moss & Pauly Howard | Hour 1
51.6K2 -
 52:44
52:44
Candace Show Podcast
4 hours agoMy Conversation with Only Fans Model Lilly Phillips | Candace Ep 122
63K233 -
 UPCOMING
tacetmort3m
5 hours ago🔴 LIVE - RELIC HUNTING CONTINUES - INDIANA JONES AND THE GREAT CIRCLE - PART 5
30.2K -
 26:52
26:52
Silver Dragons
3 hours agoCoin Appraisal GONE WRONG - Can I Finally Fool the Coin Experts?
17.2K2 -
 UPCOMING
Bare Knuckle Fighting Championship
9 hours agoBKFC on DAZN HOLLYWOOD WARREN vs RICHMAN WEIGH IN
16K -
 6:49:16
StoneMountain64
7 hours agoNew PISTOL meta is here?
28.3K1 -
 20:58
20:58
Goose Pimples
9 hours ago7 Ghost Videos SO SCARY You’ll Want a Priest on Speed Dial
16K3 -
 2:24:59
The Nerd Realm
7 hours ago $2.61 earnedHollow Knight Voidheart Edition #09 | Nerd Realm Playthrough
33.9K2