Premium Only Content

NASA’s New Scientific Breakdown of Dramatic Caldor and Dixie Fires
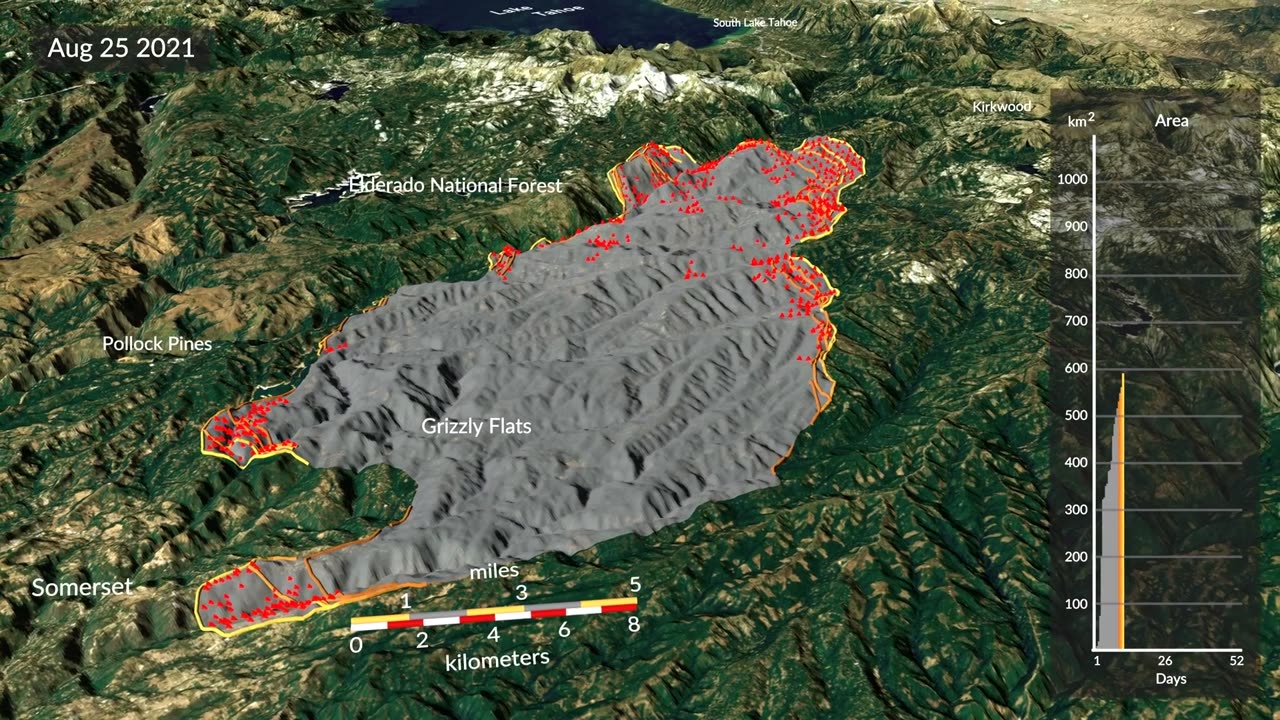
This visualization shows the spread of the Caldor fire between August 15 and October 6, 2021, and the Dixie fire between July 14 and October 22, 2021, updated every 12 hours from a new fire detection and tracking approach based on near-real time active fire detections from the VIIRS sensor on the Suomi-NPP satellite. The yellow outlines track the position of the active fire lines for the last 60 hours, with the latest location of the fire front in the brightest shade of yellow. The red points show the location of active fire detections, while the grey region shows the estimated total area burned. The graph shows the cumulative burned area in square kilometers. Editor's Note: The spelling of Eldorado National Forest appears incorrectly in the visualization. Music credit: “Color Chart” and “Abstract Dimensions” from Universal Production Music Credit: NASA's Goddard Space Flight Center Kathleen Gaeta (GSFC AIMMS): Lead Producer Cindy Starr (GST): Lead Animator Doug Morton (NASA GSFC): Lead Scientist This video is public domain and along with other supporting visualizations can be downloaded from NASA Goddard's Scientific Visualization Studio at: https://svs.gsfc.nasa.gov/31184 If you liked this video, subscribe to the NASA Goddard YouTube channel: https://www.youtube.com/NASAGoddard Follow NASA’s Goddard Space Flight Center · Instagram http://www.instagram.com/nasagoddard · Twitter http://twitter.com/NASAGoddard · Twitter http://twitter.com/NASAGoddardPix · Facebook: http://www.facebook.com/NASAGoddard · Flickr http://www.flickr.com/photos/gsfc
-
 1:32:50
Kim Iversen
6 hours agoSHOCKING: New Evidence That Fauci Lied, People Died | Thank You, Dr. Fauci
82.2K58 -
 1:31:04
Glenn Greenwald
6 hours agoBiden Admin Pledges Every Last Penny To Ukraine; Russia Hysteria Explodes After Tulsi Nomination; Biden's Fraudulent Israel Ultimatum | SYSTEM UPDATE #366
105K82 -
 1:31:25
Precision Rifle Network
11 hours agoS3E7 Guns & Grub with special guest Benchrest Marksman
24.2K -
 LIVE
LIVE
tacetmort3m
8 hours ago🔴 LIVE - BUG ONLY STREAM (SOLO OR MAYBE TEAM?) - HELLDIVERS 2
147 watching -
 1:40:28
Roseanne Barr
4 hours ago $22.10 earnedUnredacting Jesus with Billy Phillips | The Roseanne Barr Podcast #74
64.3K30 -
 30:41
30:41
Stephen Gardner
5 hours ago🔥Trump SHOCKS world: Tulsi Gabbard READY to REVAMP CIA and FBI
40.3K31 -
 55:28
55:28
LFA TV
1 day agoThe War in 2024 | Trumpet Daily 11.14.24 9PM EST
26.4K4 -
 LIVE
LIVE
VOPUSARADIO
4 days agoPOLITI-SHOCK! W/ SPECIAL GUESTS FORMER WWE & AEW SUPERSTAR- JAKE HAGER & SILICON SATAN AUTHOR CREGG LUND
116 watching -
 1:05:24
Donald Trump Jr.
9 hours agoShaking up the Swamp and We’re Just Getting Started, Plus Interview with Tom Homan TRIGGERED Ep.191
178K228 -
 1:08:37
Havoc
8 hours agoFourth Quarter Drops | Stuck Off the Realness Ep. 19
30K