Premium Only Content

NASA Summer 1880 to 2023 Temperature Media Resources
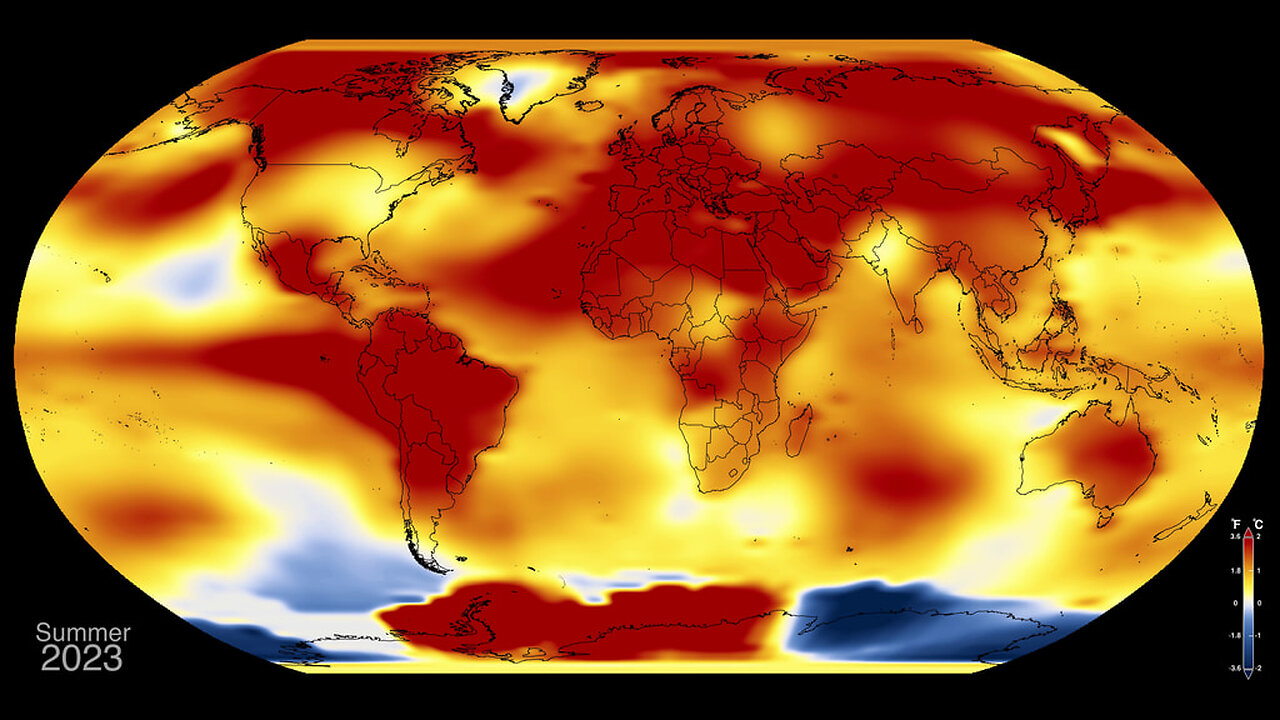
NASA Summer 1880 to 2023 Temperature Media Resources The summer of 2023 was Earth’s hottest since global records began in 1880, according to an analysis by scientists at NASA’s Goddard Institute of Space Studies (GISS) in New York. The months of June, July, and August combined were 0.41 degrees Fahrenheit (0.23 degrees Celsius) warmer than any other summer in NASA’s record, and 2.1 degrees F (1.2 C) warmer than the average summer between 1951 and 1980. August alone was 2.2 F (1.2 C) warmer than the average. June through August is considered meteorological summer in the Northern Hemisphere. This new record comes as exceptional heat swept across much of the world, exacerbating deadly wildfires in Canada and Hawaii, and searing heat waves in South America, Japan, Europe, and the U.S., while likely contributing to severe rainfall in Italy, Greece, and Central Europe. NASA assembles its temperature record, known as GISTEMP, from surface air temperature data acquired by tens of thousands of meteorological stations, as well as sea surface temperature data from ship- and buoy-based instruments. This raw data is analyzed using methods that account for the varied spacing of temperature stations around the globe and for urban heating effects that could skew the calculations. This map shows monthly temperature anomalies measure from 1880 to August 2023 measured with respect to a the baseline period 1951-1980. Released Thursday, September 14th, 2023 This video is public domain and along with other supporting visualizations can be downloaded from the Scientific Visualization Studio at: http://svs.gsfc.nasa.gov/13425 Credit: NASA's Goddard Space Flight Center/ Jocelyn Argueta/Kathryn Mersmann/Sofie Bates If you liked this video, subscribe to the NASA Goddard YouTube channel: http://www.youtube.com/NASAExplorer Follow NASA’s Goddard Space Flight Center • Instagram http://www.instagram.com/nasagoddard • Twitter http://twitter.com/NASAGoddard • Twitter http://twitter.com/NASAGoddardPix • Facebook: http://www.facebook.com/NASA.GSFC • Flickr http://www.flickr.com/photos/gsfc
-
 2:45:33
Sgtfinesse
6 hours agoMerry Christmas Night
38.4K16 -

tacetmort3m
23 hours ago🔴 LIVE - (MERRY CHRISTMAS) TIME TO SPREAD DEMOCRACY - HELLDIVERS 2 OMENS OF TYRANNY
18.4K2 -
 12:42
12:42
Cooking with Gruel
21 hours agoBrown Butter Trifle with Salted Caramel and Cinnamon Apple
14.4K3 -
 2:46
2:46
BIG NEM
10 hours agoDiscovering RAKIJA: The Holy Liquer of the Balkans
11.8K2 -
 1:11:38
Film Threat
14 hours agoCHRISTMAS DAY CHILL STREAM WITH CHRIS GORE | Hollywood on the Rocks
134K30 -
 14:22:40
The Quartering
1 day agoYule Log Christmas MAGA Edition With Memes! Come Hang Out!
224K29 -
 38:41
38:41
MYLUNCHBREAK CHANNEL PAGE
1 day agoTimeline Begins in 1800? - Pt 1 & 2
104K56 -
 1:23:41
Game On!
1 day ago $13.56 earnedNetflix NFL Christmas Games Preview and Predictions!
91.2K12 -
 2:05:07
Darkhorse Podcast
1 day agoWhy Trump Wants Greenland: The 257th Evolutionary Lens with Bret Weinstein and Heather Heying
319K877 -
 8:50:58
Right Side Broadcasting Network
1 day ago🎅 LIVE: Tracking Santa on Christmas Eve 2024 NORAD Santa Tracker 🎅
417K65