Premium Only Content

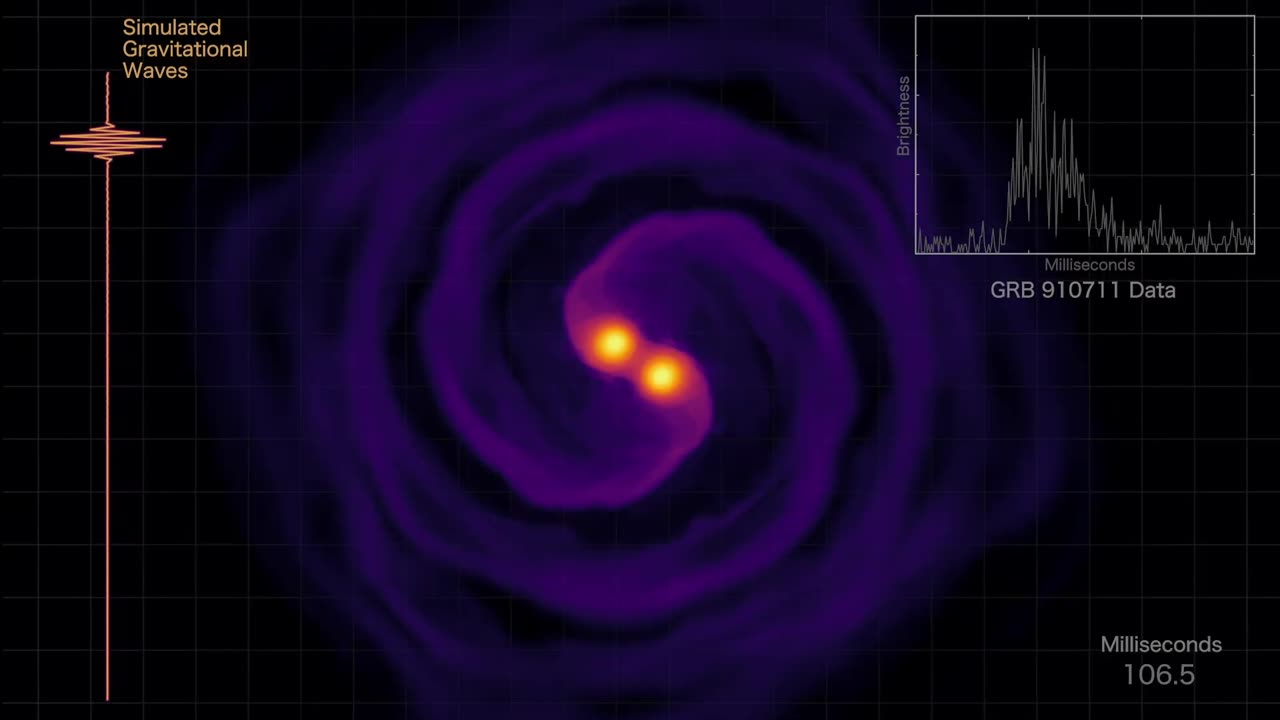
Neutron Star Merger Simulation with Gamma-ray Observations
This animation follows the gravitational wave and density changes in a simulated neutron star merger and compares them to measurements of a short gamma-ray burst observed by NASA's Compton mission on July 11, 1991. Dark purple colors represent the lowest-density material, while yellow-white shows the highest. An audible tone and a visual frequency scale (at left) track the steady rise in the frequency of gravitational waves as the neutron stars close. When the objects merge at 19 seconds, the gravitational waves suddenly jump to frequencies of thousands of hertz and bounce between two primary tones. A magenta line appears at left to illustrate how quasiperiodic oscillations (QPOs) found in the gamma-ray emission correlate to those of the simulated gravitational waves. At the same time, a graph at upper right traces the changes in gamma-ray brightness observed during the same burst. To symbolize the ultimate formation of a black hole, a dot has been added at the center.
Credit: NASA's Goddard Space Flight Center and STAG Research Centre/Peter Hammond
Scott Wiessinger (KBRwyle) - Lead Producer
Francis Reddy (University of Maryland College Park) - Lead Science Writer
Cecilia Chirenti (University of Maryland, College Park) - Scientist
This video can be freely shared and downloaded at https://svs.gsfc.nasa.gov/14209. While the video in its entirety can be shared without permission, the music and some individual imagery may have been obtained through permission and may not be excised or remixed in other products. Specific details on such imagery may be found here: https://svs.gsfc.nasa.gov/14209. For more information on NASA’s media guidelines, visit https://nasa.gov/multimedia/guidelines.
-
 3:03:27
vivafrei
23 hours agoEp. 242: Barnes is BACK AGAIN! Trump, Fani, J6, RFK, Chip Roy, USS Liberty AND MORE! Viva & Barnes
202K209 -
 8:09:50
Dr Disrespect
21 hours ago🔴LIVE - DR DISRESPECT - MARVEL RIVALS - GOLD VANGUARD
211K34 -
 1:15:00
Awaken With JP
20 hours agoMerry Christmas NOT Happy Holidays! Special - LIES Ep 71
272K220 -
 1:42:21
The Quartering
22 hours agoTrump To INVADE Mexico, Take Back Panama Canal Too! NYC Human Torch & Matt Gaetz Report Drops!
199K116 -
 2:23:15
Nerdrotic
21 hours ago $15.98 earnedA Very Merry Christmas | FNT Square Up - Nerdrotic Nooner 453
147K16 -
 1:14:05
Tucker Carlson
21 hours ago“I’ll Win With or Without You,” Teamsters Union President Reveals Kamala Harris’s Famous Last Words
253K394 -
 1:58:31
The Dilley Show
21 hours ago $38.23 earnedTrump Conquering Western Hemisphere? w/Author Brenden Dilley 12/23/2024
184K52 -
 1:09:59
Geeks + Gamers
22 hours agoSonic 3 DESTROYS Mufasa And Disney, Naughty Dog Actress SLAMS Gamers Over Intergalactic
125K21 -
 51:59
51:59
The Dan Bongino Show
23 hours agoDemocrat Donor Admits The Scary Truth (Ep. 2393) - 12/23/2024
973K3.29K -
 2:32:15
Matt Kohrs
1 day agoRumble CEO Chris Pavlovski Talks $775M Tether Partnership || The MK Show
151K36