Transit Graph: Mapping Time and Brightness| 4K
1 year ago
5
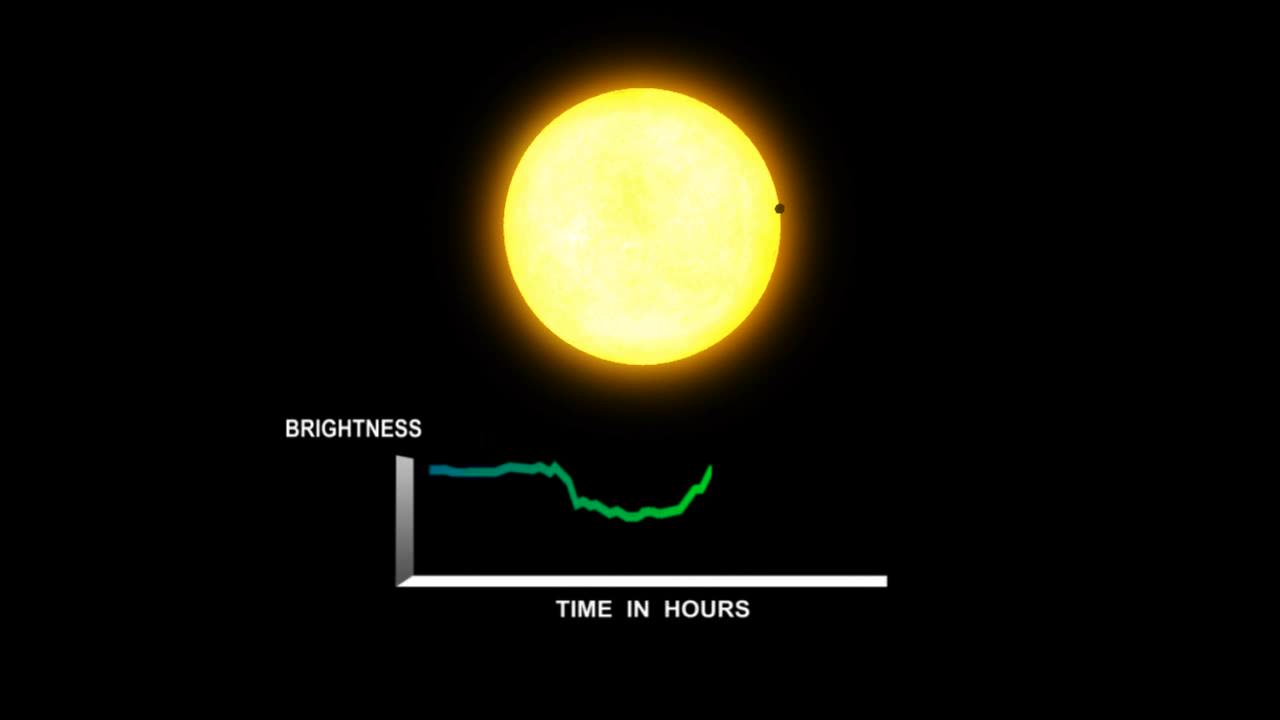
Explore the dynamic relationship between time and brightness through the captivating visual of a transit graph. Witness the ebb and flow of data as it charts the changing luminance over time, revealing patterns and insights. Immerse yourself in the dance of light and shadow that paints a vivid picture of celestial phenomena.
Loading comments...
-
 3:12:08
MyronGainesX
5 hours ago $23.63 earnedDan Bongino Named As Deputy Director Of FBI And CPAC Recap
64.2K18 -

vivafrei
5 hours agoBarnes Live from Seattle - Defending Benshoof in a Case that is CRAY CRAY!
78K24 -
 2:12:12
Robert Gouveia
5 hours agoLiberals EXPLODE over Elon's Email; Lawsuits FLY; Sanctions?? Congrats Dan!
48.3K19 -
 1:33:36
Redacted News
6 hours agoBREAKING! PUTIN LAUNCHES MASSIVE OFFENSIVE IN UKRAINE AS EUROPEAN LEADERS PUSH FOR MORE WAR
127K209 -
 44:39
44:39
Kimberly Guilfoyle
6 hours agoBetter Days Ahead for the FBI, Live with Asm Bill Essayli & John Koufos | Ep.199
82.3K24 -
 1:40:29
In The Litter Box w/ Jewels & Catturd
1 day agoWhat Did You Do Last Week? | In the Litter Box w/ Jewels & Catturd – Ep. 748 – 2/24/2025
127K36 -
 23:34
23:34
Stephen Gardner
6 hours ago🔥CNN PANICS over $5000 DOGE Dividend | Trump Orders bigger Audits
67.6K129 -
 1:53:54
The White House
8 hours agoPresident Trump Holds a Press Conference with President Emmanuel Macron of France
89.6K82 -
 1:48:31
The Officer Tatum
8 hours agoLIVE MSNBC DROPS HAMMER On Joy Reid as STAFFERS PANIC! + More Ep 67
122K79 -
 59:36
59:36
Chad Prather
7 hours agoTRUMP TAPS DAN BONGINO TO HELP LEAD FBI - IT’S OVER FOR THE DEEP STATE!
90.1K64